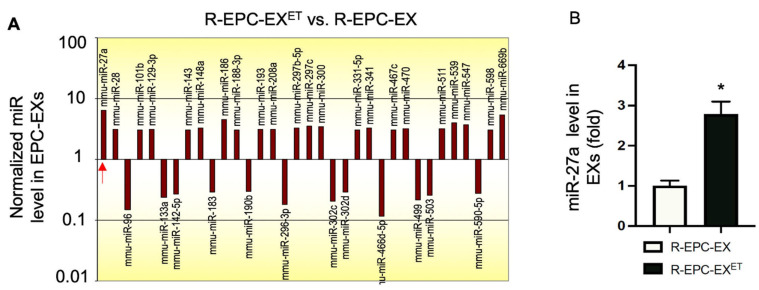
Figure 2.
Profiling analysis of exosomal miRs and qRT-PCR of miR-27a in EPC-EXs of exercised and sedentary hypertensive mice. (A) representative miR profiling graph showing the changes of miRs in EPC-EXs. MiRs with down- or up-regulated >3-fold are listed. (B) qRT-PCR verified the miR-27a level in EPC-EXs. * p < 0.05, vs. R-EPC-EX. Data are expressed as mean ± SD, n = 3/group.

