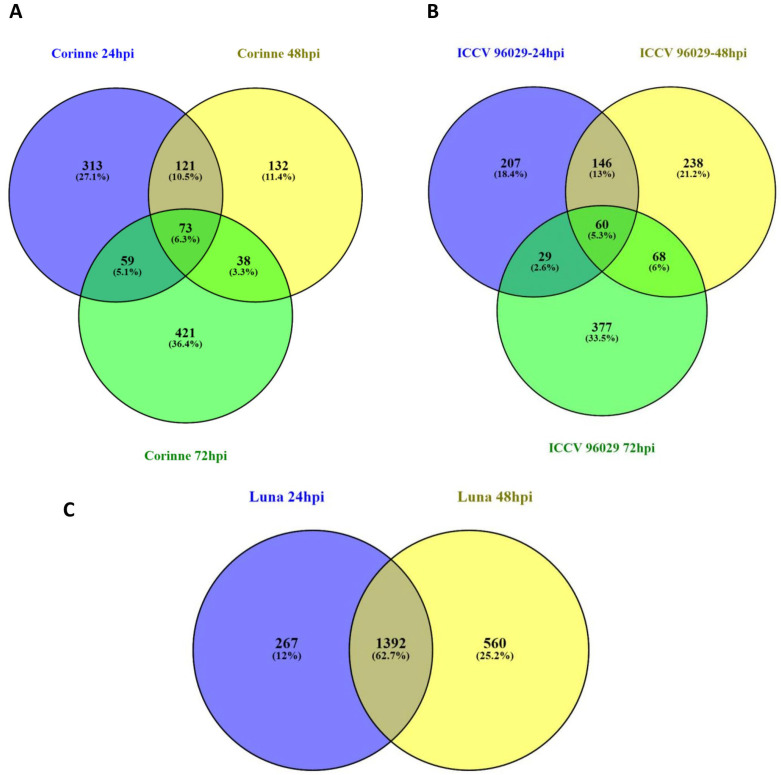
Figure 3.
Comparative analysis of the changes in the chickpea transcriptomes in response to A. rabiei at three different time points after inoculation. Venn diagrams comparing differentially expressed genes between three different time points 24, 48 and 72 hpi in (A) ICCV 96029, (B) CDC Corinne and (C) CDC Luna.

