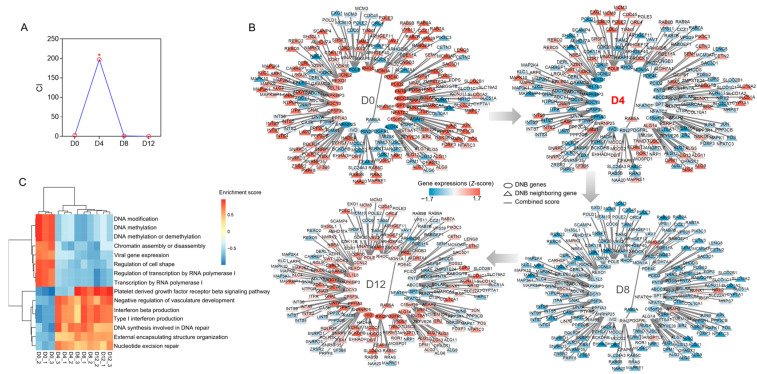
Figure 4.
Dynamic network analysis of PVC development. (A) Criticality index (CI) scores at each time point of PVC development. The score was higher for D4 than for other time points, indicating that D4 was the differentiation tipping point. The asterisk (*) indicates the peak value. (B) Dynamic expression of DNBs and adjacent DEGs at different developmental stages. (C) Gene set variation analysis of all genes in the DNB member-centered network. Enrichment scores of the top 15 significant GO terms were analyzed for each sample based on the gene-set expression levels for each term.

