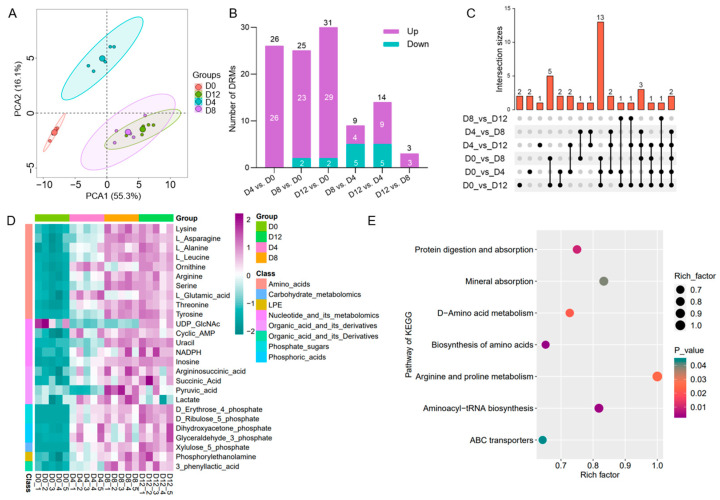
Figure 6.
Characteristics of PVC energy metabolomics at various time points during differentiation. (A) PCA of all metabolites in the energy metabolome. (B) Summary of the DRM count across any two comparison groups. (C) UpSet plot of six comparison sets, displaying the number of common and unique DEGs. (D) Heatmap of 26 DRMs at four time points of PVC differentiation, based on the metabolite content of 20 samples. (E) KEGG enrichment analysis of 26 DRMs.

