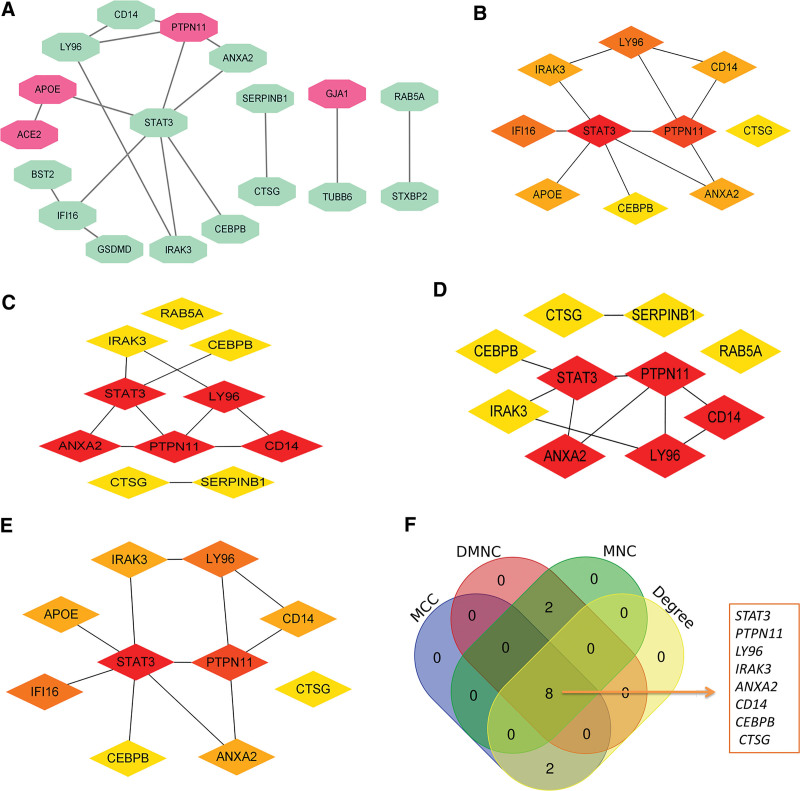
Figure 3.
The PPI network analysis. (A) The PPI network of the DEPRGs. Red indicates upregulated, and green is downregulated. (B) Top 10 nodes detected by MCC. (C) Top 10 nodes detected by DMNC. (D) Top 10 nodes detected by MNC. (E) Top 10 nodes detected by Degree. (F) The 4 algorithms utilized to identify hub genes. DEPRGs = differentially expressed pyroptosis-related genes.

