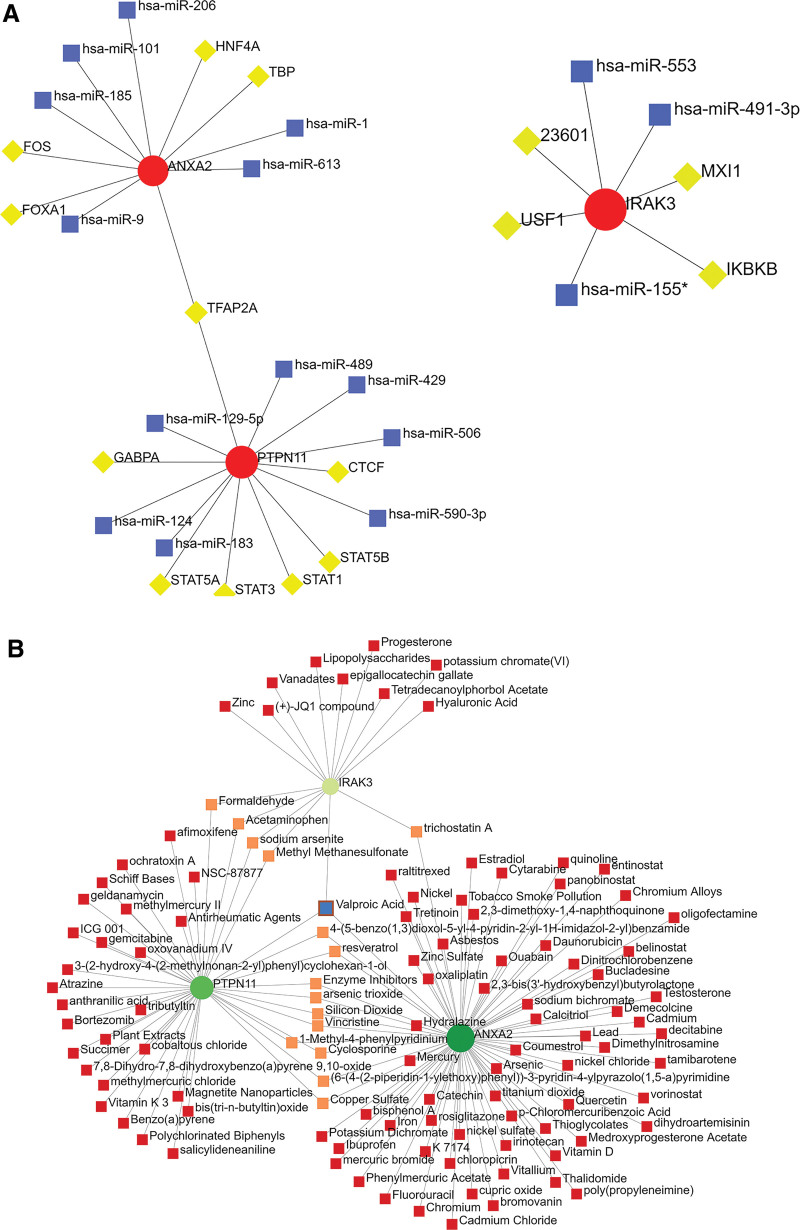
Figure 6.
NetworkAnalyst analysis of hub genes. (A) TF-miRNA coregulatory network. The red nodes represent the key biomarkers, the yellow nodes are TF genes, and the blue nodes indicate miRNA. (B) Protein-chemical interactions. The green nodes represent the key biomarkers. The pink nodes represent compounds that interact in common between 2 key biomarkers. The blue node represent compound that interact with the 3 key biomarkers.

