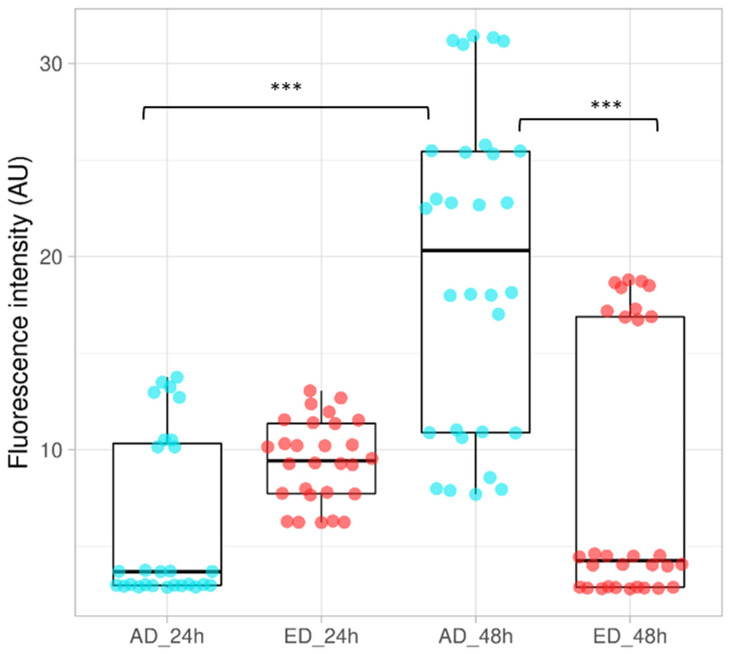
Figure 10.
Mitochondrial activity of STRO-1+ A pre-osteoblasts cultured on Fn adsorbed (AD), or electrodeposited (ED) on supports for 24 h and 48 h. Activity measured for cells cultured on AD are represented by blue dots. Red dots are results obtained for cells cultured on ED substrates The box represents the data, with the horizontal line indicating the median value. (ANOVA test was performed, n = 3, *** p < 0.001).

