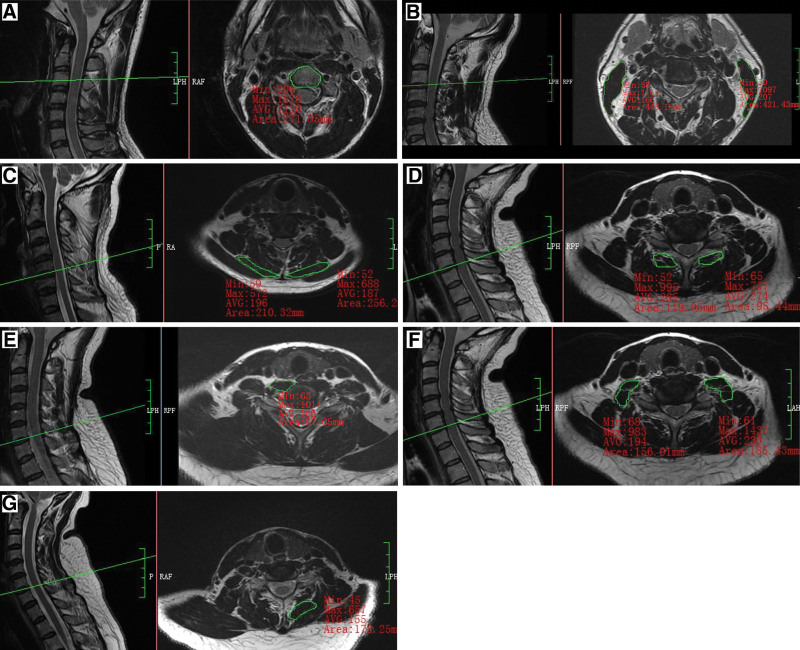
Figure 2.
Schematic diagram of CSA measurement of the CPMs and VB. (A) CSA of splenius capitis muscle (SPCAP) showing a value of 210.32 mm2 (left) and 256.26 mm2 (right) at C5/6. (B) CSA of longus capitis muscle (LCAP) plus the long cervical muscle (LC) showing a value of 87.65 mm2 (left) at C6/7. (C) CSA of the anterior scalene (SA) plus the medium scalene (SM) plus the posterior scalene (SP) showing a value of 156.01 mm2 (left) and 185.43 mm2 (right) at C6/7. (D) CSA of semispinalis capitis muscle (SSCAP) plus the semispinalis cervicis muscle (SSC) showing a value of 172.25 mm2 at C6/7 (right). (E) CSA of the sternocleidomastoid muscle (SCM) showing a value of 119.05 mm2 (left) and 95.44 mm2 (right) at C6/7. (F) CSA of the cervical vertebra (VB) showing a value of 271.85 mm2 at C3. CSA = cross-sectional area.

