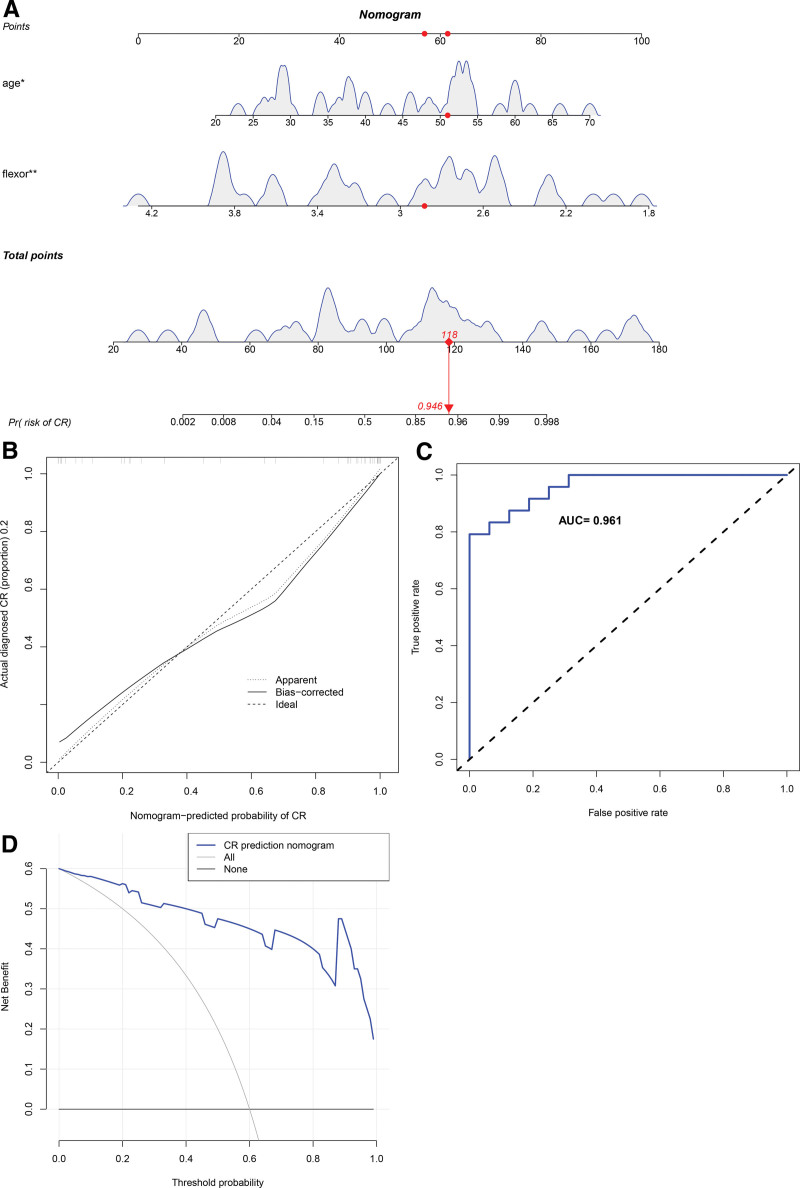
Figure 4.
The clinical and assessment models in the external validation set. (A) The prediction interval of the nomogram ranging between 0.002 and 0.998. (B) The calibration curve showing consistency between the observed and the ideal values. (C) The ROC curve verification of the accuracy of the model, which was as high as 0.96. (D) The net benefit of the clinical predictive model ranging between 0.01 and 0.99. ROC = receiver operating characteristic.

