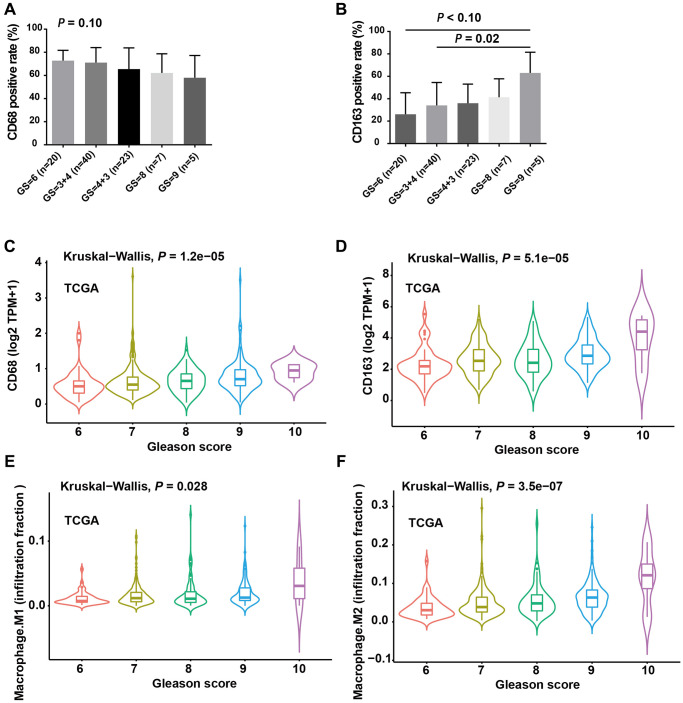
Figure 2.
The infiltration levels of M2 TAMs were positively correlated with Gleason score. (A) CD68 positive rate was moderately negatively correlated with Gleason score (GS). (B) CD163 positive rate increased with increasing GS and the difference was more obverse between GS = 9 and GS = 6/3+4 group. (C) Violin plot showed the expression level of CD68 mRNA with increasing GS. (D) The expression level of CD274 mRNA was positively correlated with GS. (E) Violin plot showed the infiltration levels of M1 macrophages with increasing GS. (F) Violin plot showed the infiltration levels of M2 macrophages with increasing GS. A, B and C. ANOVA test; C, D and E, Kruskal-Wallis test.

