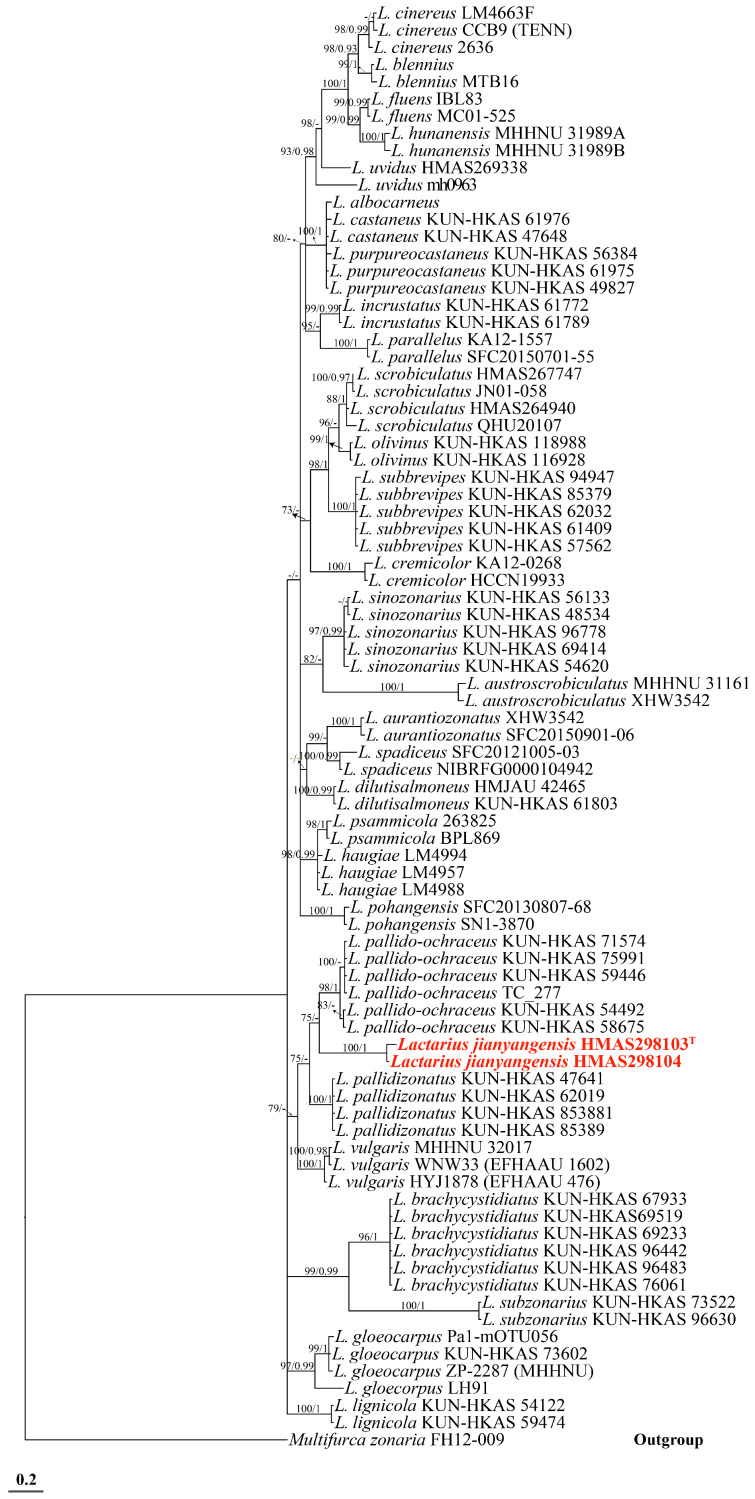
Figure 1.
Phylogeny inferred from Lactarius multigene sequences (nrLSU, ITS, mtSSU, rpb2, and tef1-α) using Bayesian analysis. Support values in normal type are bootstrap support (BS, significant when ≥70%). Values in bold are Bayesian Posterior Probabilities (PP, significant when ≥0.95). The scale bar indicates the number of nucleotide substitutions per site. New species are highlighted in red. Arrows show the support values at the branching points. Superscript “T” denotes the type strain of the new species.

