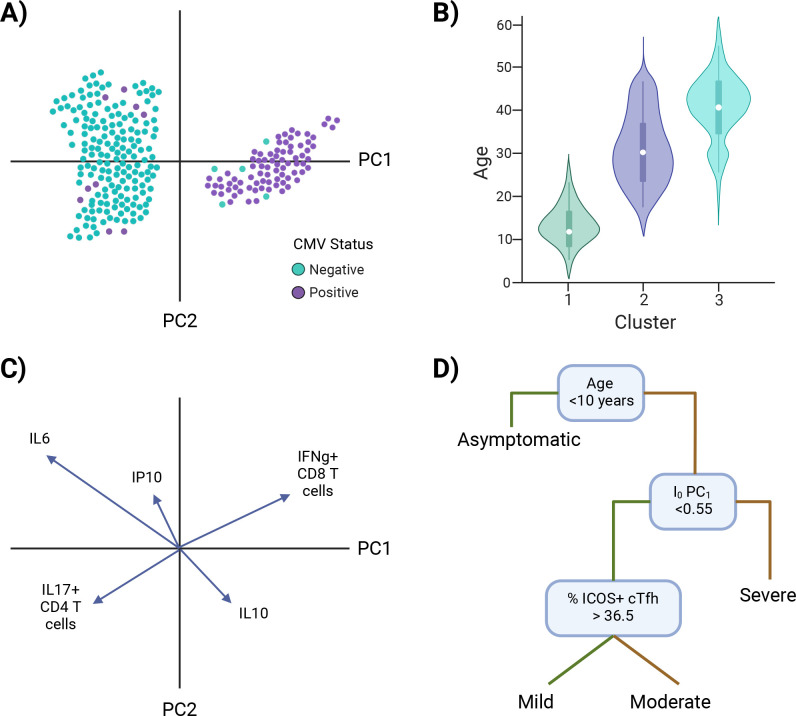
Figure 5. Investigating I0.
Examples of approaches to identify characteristic features of I0 clusters (A–C) and infer I0 associations with susceptibility to infection or disease severity (D). (A) Example of overlaying the value of a putative independent variable, cytomegalovirus (CMV) status, on a principal component analysis (PCA) graph. (B) Example of subsetting the data by cluster identity and comparing values of a potential defining variable, age. (C) Example of a PCA loading plot. (D) Example of a decision tree analysis, in which an I0 value, PC1, is associated with susceptibility to severe disease. Green lines = true, yellow lines = false. *Note: Examples are not related to each other.

