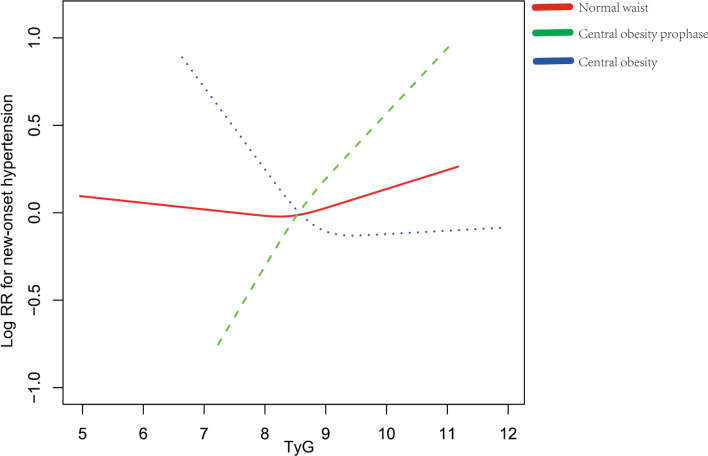
Figure 2.
Adjusted cubic spline model of the relationship of baseline TyG with risk of new-onset hypertension. The solid line and dashed line represent the estimated values and their corresponding 95% confidence interval. Adjustment factors included age, gender, smoke, drink, marital status, education level, sleep duration, BMI, diabetes, WBC, PLT, MCV, hemoglobin, hematocrit, CRP, BUN, creatine, uric acid, HDL-C, LDL-C, pulse, use of hypoglycemic drugs, use of lipid-lowering drugs, per capita household consumption, SBP and DBP. Abbreviations: BMI, body mass index; BUN, blood urea nitrogen; CRP, C-reactive protein; DBP, diastolic blood pressure; FBG, fasting blood glucose; HbA1c, hemoglobin A1c; HDL-C, high-density lipoprotein cholesterol; LDL-C, low-density lipoprotein cholesterol; MCV, mean corpuscular volume; PLT, platelet; RR, relative risk; SBP, systolic blood pressure; TyG, triglyceride glucose index; WBC, white blood cell.

