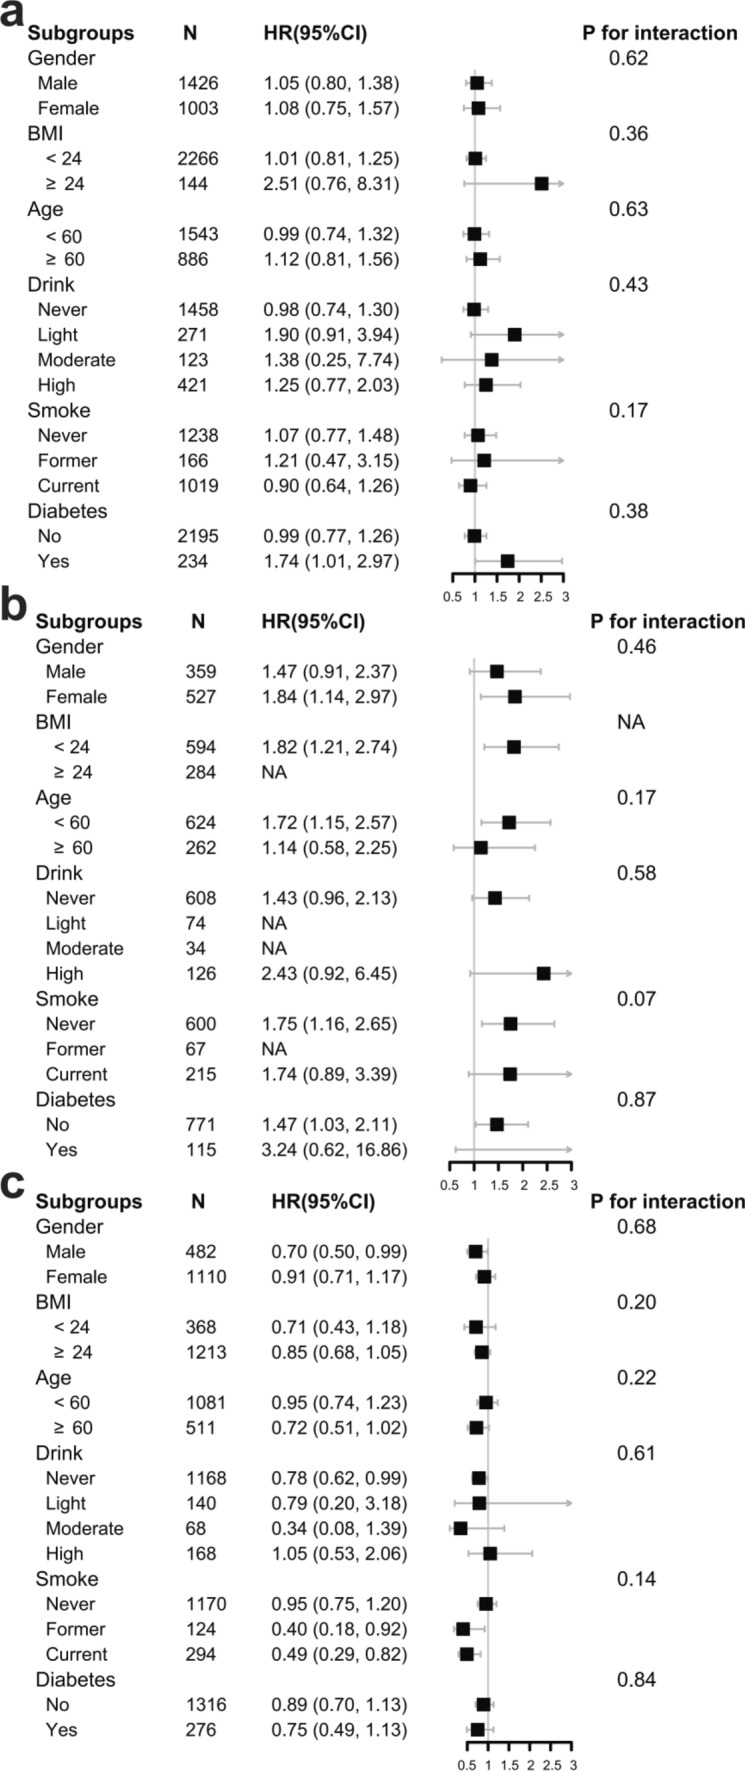
Figure 3.

Subgroup analyses of the association between TyG index and new-onset hypertension in individuals with normal waist (a), central obesity prophase (b) and central obesity (c). The multivariate model was adjusted for age, gender, smoke, drink, marital status, education level, sleep duration, BMI, diabetes, WBC, PLT, MCV, hemoglobin, hematocrit, CRP, BUN, creatine, uric acid, HDL-C, LDL-C, pulse, use of hypoglycemic drugs, use of lipid-lowering drugs, per capita household consumption, SBP and DBP, with the exception of the variable that was stratified. Subgroup for diabetes was adjusted for age, gender, smoke, drink, marital status, education level, sleep duration, BMI, WBC, PLT, MCV, hemoglobin, hematocrit, CRP, BUN, creatine, uric acid, HDL-C, LDL-C, pulse, use of lipid-lowering drugs, per capita household consumption, SBP and DBP. Abbreviations: BMI, body mass index; BUN, blood urea nitrogen; CRP, C-reactive protein; DBP, diastolic blood pressure; FBG, fasting blood glucose; HbA1c, hemoglobin A1c; HDL-C, high-density lipoprotein cholesterol; LDL-C, low-density lipoprotein cholesterol; MCV, mean corpuscular volume; PLT, platelet; SBP, systolic blood pressure; TyG, triglyceride glucose index; WBC, white blood cell.
