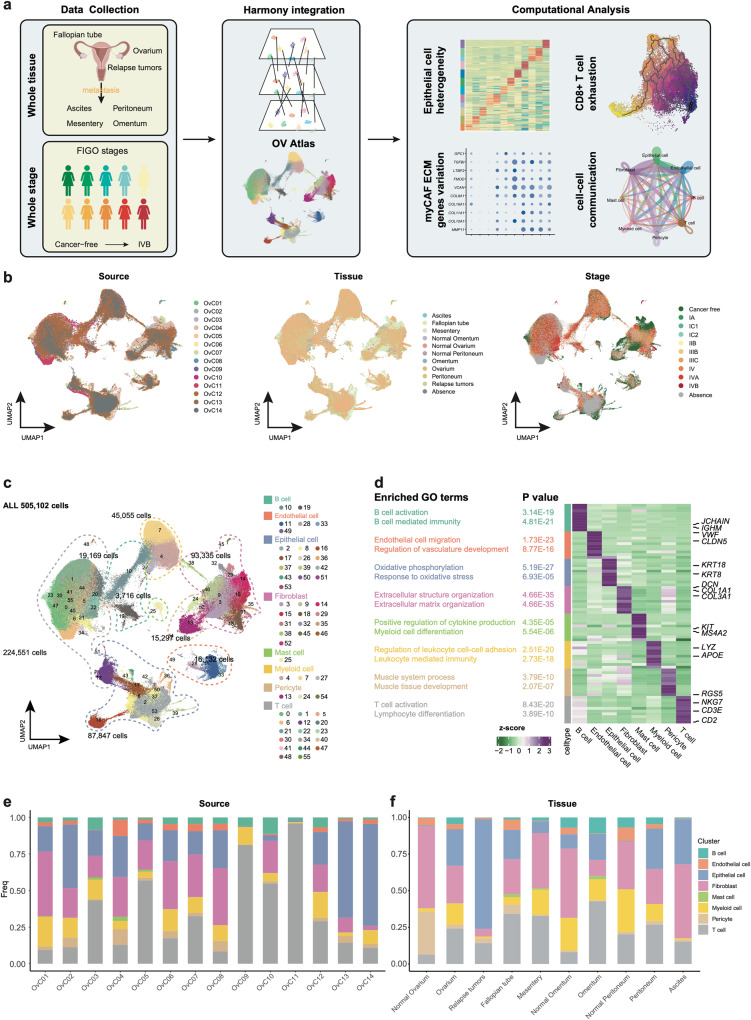
Fig. 1. Dissection of ovarian cancers with scRNA-seq.
a Workflow depicting the collection and processing of ovarian cancer for scRNA-seq. Illustration of female reproductive system and female icons were created with BioRender.com with licensed for use in journal publications. b The UMAP plot shows cell literature source, tissue and stage by color. c The UMAP plot demonstrates the major cell types in ovarian tumor and metastatic tumor foci. d The expression heatmap of top10 marker genes for major cell type and the GO enrichment term of marker genes. e Stacked bar graph of the proportion of major cell types in each literature source in scRNA-seq profiles. f Stacked bar graph of the proportion of major cell types in each metastatic tumor foci in scRNA-seq profiles.

