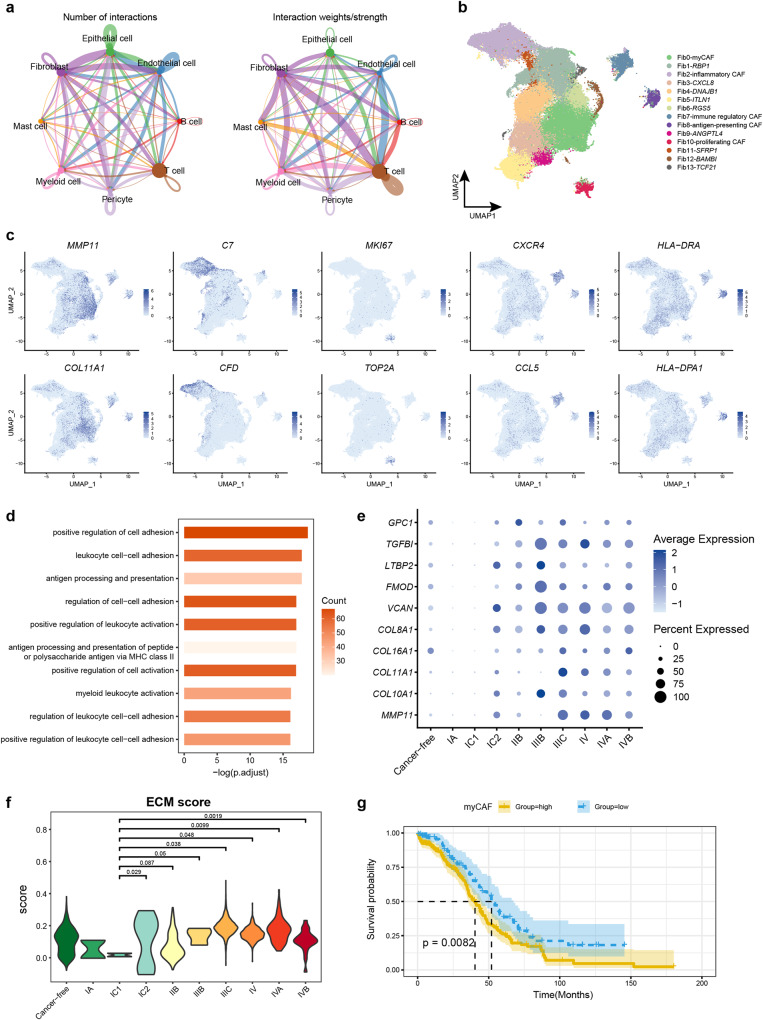
Fig. 4. Antigen-presenting CAF was identified and enhanced ECM function in myCAF from stage IC2.
a The number and strength of cell interactions among the major cell types of ovarian cancer. b The UMAP plot shows the fibroblast sub-clusters in ovarian tumor and metastatic tumor foci. c The UMAP plot color coded for the expression of marker genes for the fibroblast subtypes. d The bar chart shows the GO enrichment term of marker genes in Fib8. e The dot plot shows variation of ECM gene expression in myCAF with stage. f The violin plot shows change of ECM score in myCAF with stage (Total 7,438 single cell). *P < 0.05; **P < 0.01; ***P < 0.001, ****P < 0.0001. g Kaplan–Meier OS curves of patients with TCGA HGSOC grouped by the top10 marker gene of myCAF. P values were calculated by a log rank test.

