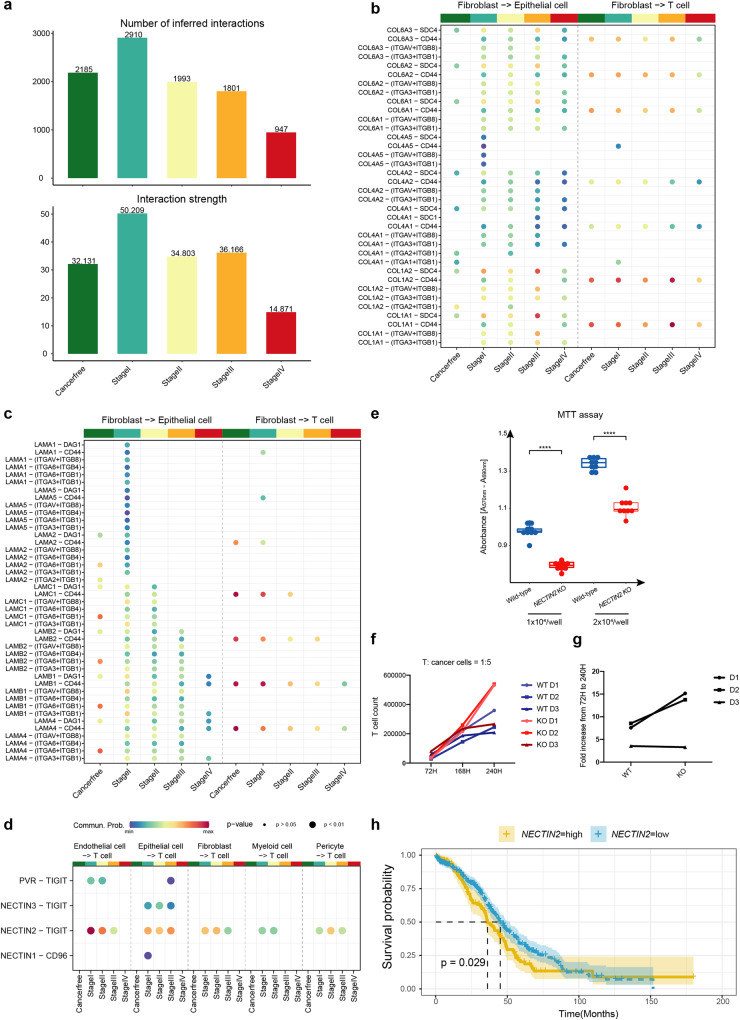
Fig. 5. Interactome between fibroblasts, epithelial cells, and T cells over OC progression.
a The bar chart shows the number and strength of cell interactions in ovarian cancer at different stages. b COLLAGEN pathway ligand-receptor cell communication probability from fibroblast to T cell. c LAMININ pathway ligand-receptor cell communication probability from fibroblast to T cell. d TIGIT ligand-receptor cell communication probability from endothelial cell, epithelial cell, fibroblast, myeloid cell, and pericyte to T cell. The color represents the communication probability and the dot size represents p value. e The inhibited cell proliferation by MTT assay in SKOV3 cells with NECTIN2 knock out using CRISPR/Cas9 (n = 9 technical replicates). f Measurement of T cell proliferation when it was co-cultured with NECTIN2 knock out SKOV3 cells and wilt type SKOV3 cells after 72 h, 168 h, and 240 h. T cells were derived from three individuals. g Fold changes of T cell proliferation when co-culturing with NECTIN2 knock out cells compared to wild-type SKOV3 cells. h NECTIN2-high and NECTIN2-low Kaplan-Meier curves of patients from the TCGA cohort. P values were calculated by a log rank test.

