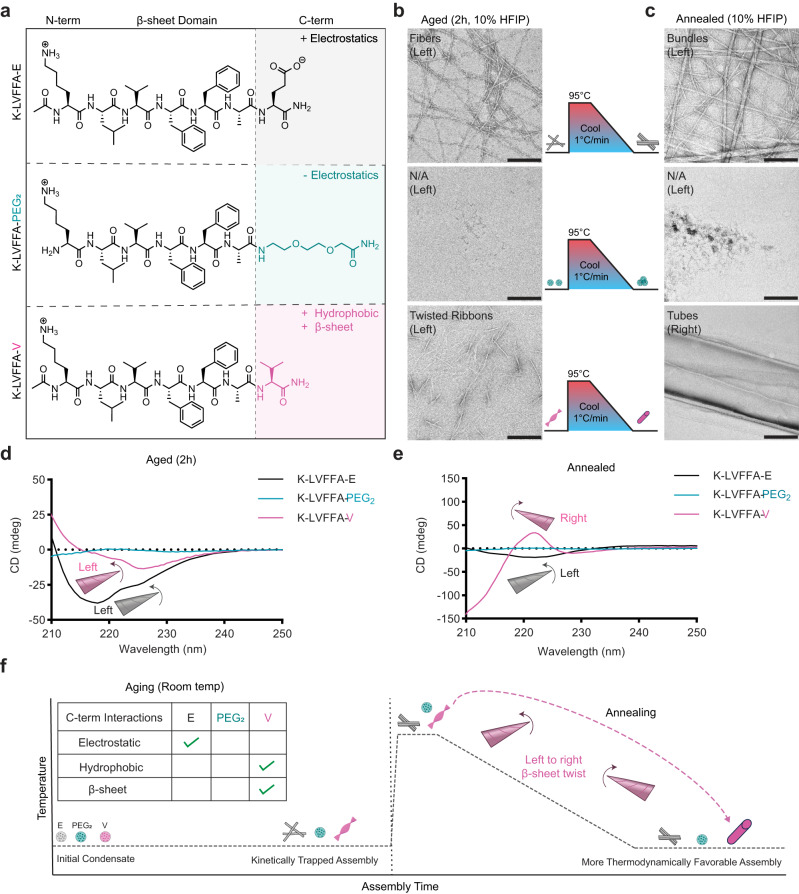
Fig. 2. Tuning driving forces for assembly nucleation directs accessible chirality.
Chemical structures (a) showing the mutations to C-terminal interactions. TEM images (b) of peptides assembled in 10% HFIP for 2 h (scale bars = 200 nm). TEM images (c) of peptides annealed in 10% HFIP for 2 h (scale bars = 200 nm). All TEM images are representative of at least two separate assemblies. CD Spectra (d) showing the peptides aged for 2 h in 10% HFIP. CD spectra (e) showing peptides after annealing in 10% HFIP. Schematic (f) of assembly pathway and driving forces responsible for morphologies at both the kinetically trapped states and more thermodynamically favorable states. In schematics and graphs, KLVFFA-E = black/gray, KLVFFA-PEG2 = teal, KLVFFA-V = pink.

