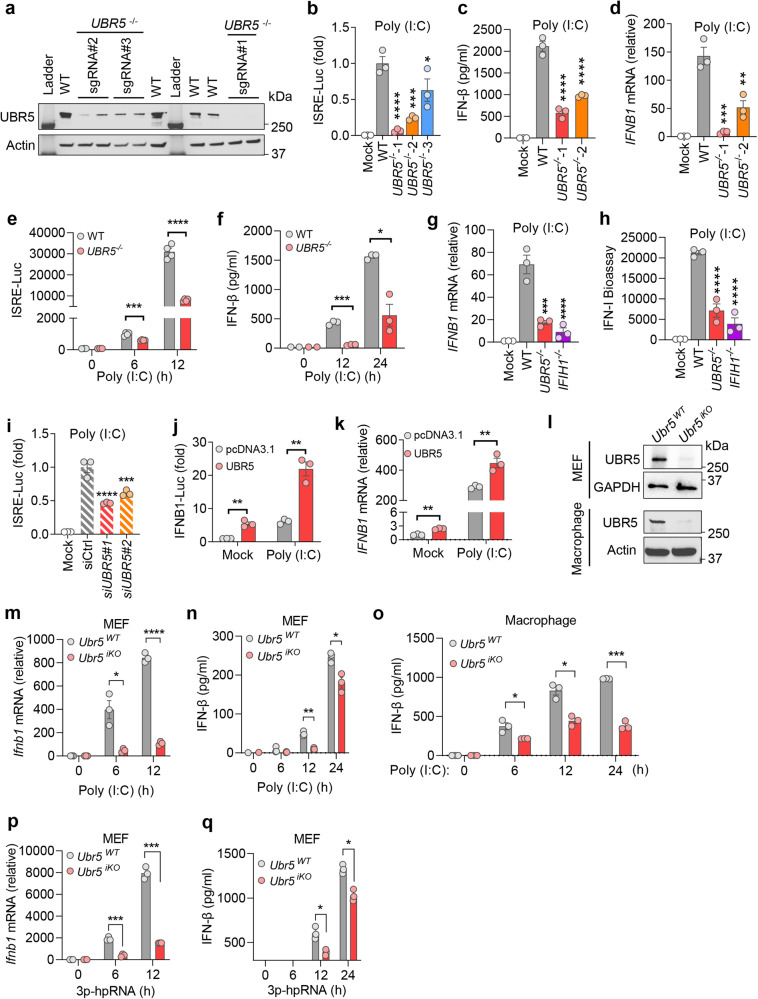
Fig. 2. UBR5 is essential for RLR signaling.
a Immunoblots of UBR5 protein in wild type (WT) and three UBR5−/− (made with unique guide RNA) in 2fTGH-ISRE-Luc cells. Quantification of the (b) intracellular ISRE-Luc activity, c secreted IFN-β protein by ELISA, d cellular IFNB1 mRNA levels in 2fTGH-ISRE-Luc cells transfected with poly (I:C) for 12 h. Quantification of the (e) intracellular ISRE-Luc activity, f secreted IFN-β protein, g cellular IFNB1 mRNA, h secreted type I IFNs (Bioassay) in WT, UBR5−/− (made with gRNA #1) and IFIH1−/− (gene symbol for MDA5) HEK293T cells transfected with poly (I:C) for 12 h. i Quantification of ISRE-Luc activity in 2fTGH-ISRE-Luc cells transfected with a negative control siRNA (siCtrl) or UBR5 siRNA for 48 h, then poly (I:C) for 12 h. j Measurement of the Luc activity in HEK293T cells transfected with a pcDNA3.1 vector or UBR5 expression plasmid, together with an IFNB1 promoter-driven firefly luciferase (Luc) and an ACTIN promoter-driven renilla Luc plasmid (internal control) for 24 h. The cells were then transfected with poly (I:C) for 12 h. k Quantification of the IFNB1 mRNA in HEK293T cells transfected with a vector or UBR5 expression plasmid for 24 h, then poly (I:C) for 12 h. l Immunoblots of UBR5 protein in mouse primary embryonic fibroblasts (MEF) or bone marrow-derived macrophages. Quantification of (m) the Ifnb1 mRNA in MEFs, secreted IFN-β protein in (n) MEFs and (o) macrophages transfected with poly (I:C). Quantification of the (p) Ifnb1 mRNA levels, q secreted IFN-β protein in MEFs transfected with 5-ppp hpRNA (RIG-I agonist). Ubr5iKO: Ubr5 inducible knockout by Tamoxifen. Data presented in b–d, g–i: mean ± S.E.M, ordinary one-way ANOVA with Dunnett’s test, n = 3 biological independent experiments; for b: ****p < 0.0001, ***p = 0.0003, *p = 0.0305 vs WT; for c: ****p < 0.0001 vs WT; for d: ***p = 0.0003, **p = 0.0022 vs WT; for g: ***p = 0.0001, ****p < 0.0001 vs WT; for h: ****p < 0.0001 vs WT; for i: ****p < 0.0001, ***p = 0.0005 vs siCtrl. Multiplicity adjusted p values are presented. Data presented in e, f, j, k, m–q: mean ± S.E.M, two-tailed student’s t test; for e: ***p = 0.0007, ****p < 0.0001, n = 4 biological independent experiments; for f: ***p = 0.0002, *p = 0.012; for j: **p = 0.0015, **p = 0.0018 in sequence; for k: **p = 0.0014, **p = 0.0084 in sequence; for m: *p = 0.0224, ****p < 0.0001; for n: **p = 0.0024, *p = 0.0407; for o: *p = 0.0478, *p = 0.0129, ***p = 0.0002 in sequence; for p: ***p = 0.0005, ***p = 0.0001 in sequence; for q: *p = 0.0263, *p = 0.0138 in sequence; n = 3 biological independent experiments in f, j, k, m–q. Adjusted p values are presented. Source data are provided as a Source Data file.

