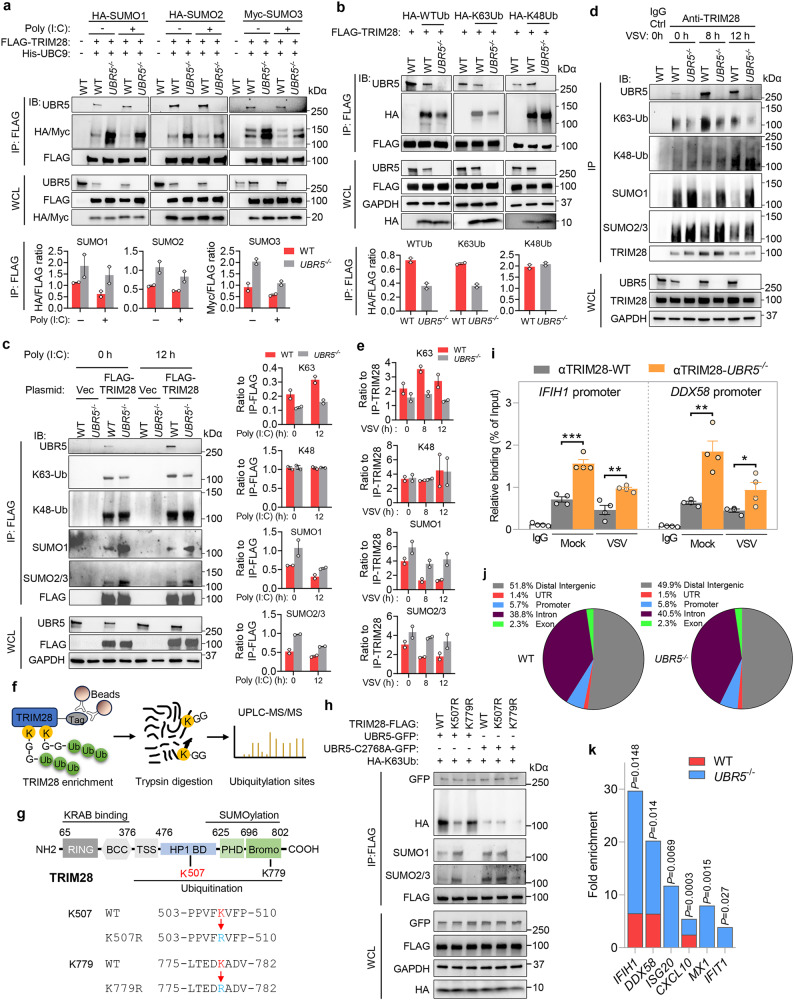
Fig. 7. UBR5 promotes K63-linked ubiquitination but inhibits SUMOylation of TRIM28.
a WT and UBR5−/− HEK293T cells were transfected with FLAG-TRIM28, His-UBC9 and HA- or Myc -SUMO plasmids for 24 h, then without (Mock) or with poly (I:C) for 12 h. FLAG-TRIM28 was immunoprecipitated (IP) with an anti-FLAG antibody, and the IP and whole cell lysate (WCL) were immuno-blotted (IB) for the indicated proteins with specific antibodies. b WT and UBR5−/− HEK293T cells were transfected with FLAG-TRIM28, HA-tagged WT, K48 or K63-only ubiquitin (Ub) for 24 h. The IP and IB was performed as above. c WT and UBR5−/− HEK293T cells were transfected with FLAG-TRIM28 or vector for 24 h, then with poly (I:C) for 12 h. The IP and IB was carried out as above. The bar chart in a–c indicates the ratios of the indicated protein band density. n = 2 biologically independent experiments. d WT and UBR5−/− HEK293T cells were infected with VSV at a MOI of 0.5. Endogenous TRIM28 was immunoprecipitated with an anti-TRIM28 antibody. e The bar chart indicates the ratios of the indicated protein band density in d. n = 2 biologically independent experiments. f The method to identify ubiquitinated sites within TRIM28. g The method for generating K507R and K779R mutants of TRIM28. h HEK293T cells were transfected with FLAG-TRIM28 (WT, K507R, K779R), GFP-UBR5, GFP-UBR5-C2758A mutant and HA-K63Ub plasmids for 24 h, then FLAG-TRIM28 was immunoprecipitated with an anti-FLAG antibody, and the IP and WCL were immunoblotted for the indicated proteins with specific antibodies. I–k WT and UBR5−/− HEK293T cells were infected with VSV at a MOI of 0.5 for 8 h. Chromatin immunoprecipitation (ChIP) was performed with an anti-TRIM28 antibody. i The TRIM28-bound RLR promoter DNA was quantified by qPCR and normalized to its input. Bar: mean ± S.E.M, two-tailed Student’s t test, n = 4 biologically independent samples, ***p = 0.0006, **p = 0.0094 for IFIH1; **p = 0.0029; *p = 0.0382. Adjusted p values are presented. j ChIP-seq analysis and genomic annotation of TRIM28-bound sites in infected cells. UTR: untranslated regions. k Fold enrichment inTRIM28-bound promoter regions of select ISGs. The P-value was generated in Peak calling statistics using a Poisson distribution with local lambda estimate. Source data are provided as a Source Data file.

