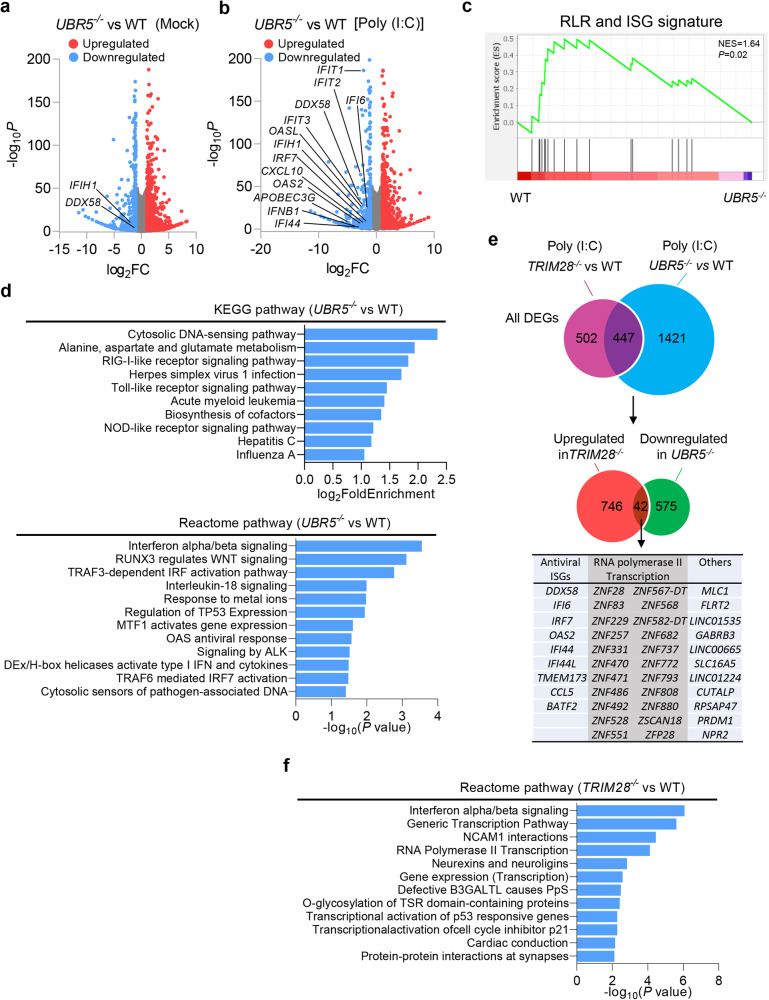
Fig. 8. The RLR-IFN axis is one of the primary common targets of UBR5 and TRIM28.
a, b Volcano plots of differentially expressed genes (DEGs) in UBR5−/− versus WT cells with/or without poly (I:C)-stimulation. Red and blue represent significant DEGs of upregulated (log2FC ≥ 1, p < 0.05) and downregulated (log2FC ≤ −1, p < 0.05), respectively. DESeq2 was used to perform a comparison of gene expression between defined groups, the Wald test was used to generate log2FC and p-values adjusted with the Benjamini–Hochberg. c GSEA plot of a significant gene set associated with RLR pathway and ISGs, p values were calculated by one-way ANOVA with Tukey’s post hoc comparison. d Top KEGG and Reactome pathways enriched from downregulated DEGs in UBR5−/− versus WT cells upon poly (I:C)-stimulation (p < 0.05, right-tailed Fisher’s exact t test with Benjamini & Hochberg). e Venn diagram revealing 42 genes overlapping between the DEGs upregulated in TRIM28−/− and downregulated in UBR5−/− cells. f Top Reactome pathways enriched from upregulated DEGs in TRIM28−/− versus WT cells upon poly (I:C)-stimulation. Source data are provided as a Source Data file.

