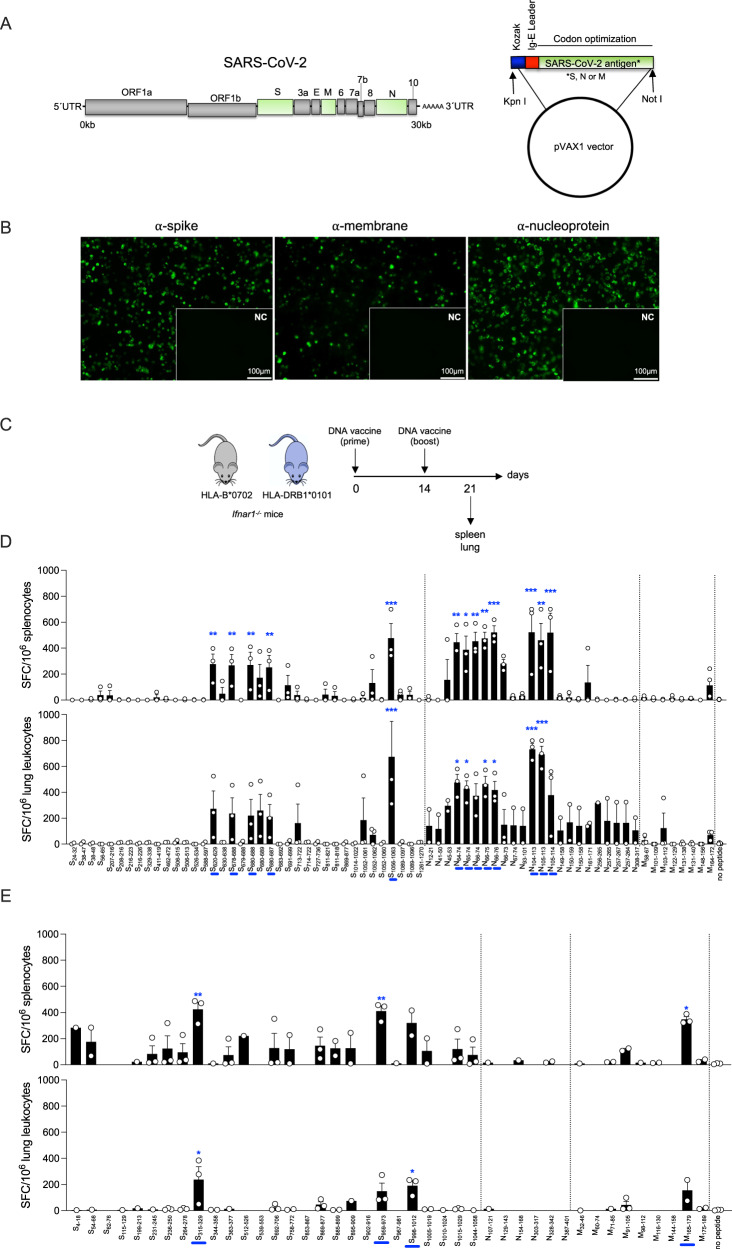
Fig. 1. Mapping SARS-CoV-2 S, N, and M protein-derived epitopes in DNA-vaccinated HLA-B*0702 and HLA-DRB1*0101 Ifnar1−/− mice.
A SARS-CoV-2 genome and DNA vaccine constructs containing mammalian-optimized Kozak sequence, IgE leader sequence, and codon-optimized DNA sequence for SARS-CoV-2 S, N, or M protein. B Representative immunofluorescence images of 293 T cells transfected with S, M, or N DNA vaccines (vs empty vector [insets]) and immunolabeled for SARS-CoV-2 S, N, or M protein (green). Scale bars apply to main panels and insets. Images are representative of 2 independent experiments. C Experimental protocol for D and E. HLA-B*0702 and HLA-DRB1*0101 Ifnar1−/− mice were administered 25 μg S, N, or M DNA vaccines by intramuscular electroporation on days 0 and 14, and tissue collected 7 days later. D, E ELISpot quantification of IFNγ-producing spot-forming cells (SFC) from HLA-B*0702 Ifnar−/− mice (D) and HLA-DRB1*0101 Ifnar−/− mice (E). Splenocytes and lung leukocytes were stimulated for 20 h with 69 (D), or 42 (E) SARS-CoV-2 peptides predicted to be immunogenic for CD8+ T cells (D) or CD4+ T cells (E; Tables 1 and 2); control, no peptide. Data are presented as the mean ± SEM; N = 4 mice/group pooled from 2 independent experiments. Peptide vs control were compared using the one-way ANOVA test. The mean of each peptide was compared to the mean of the control (no peptide). *P < 0.05; **P < 0.01; ***P < 0.001. Blue bars on the x-axis are peptides that significantly stimulated 1 or more cell types.

