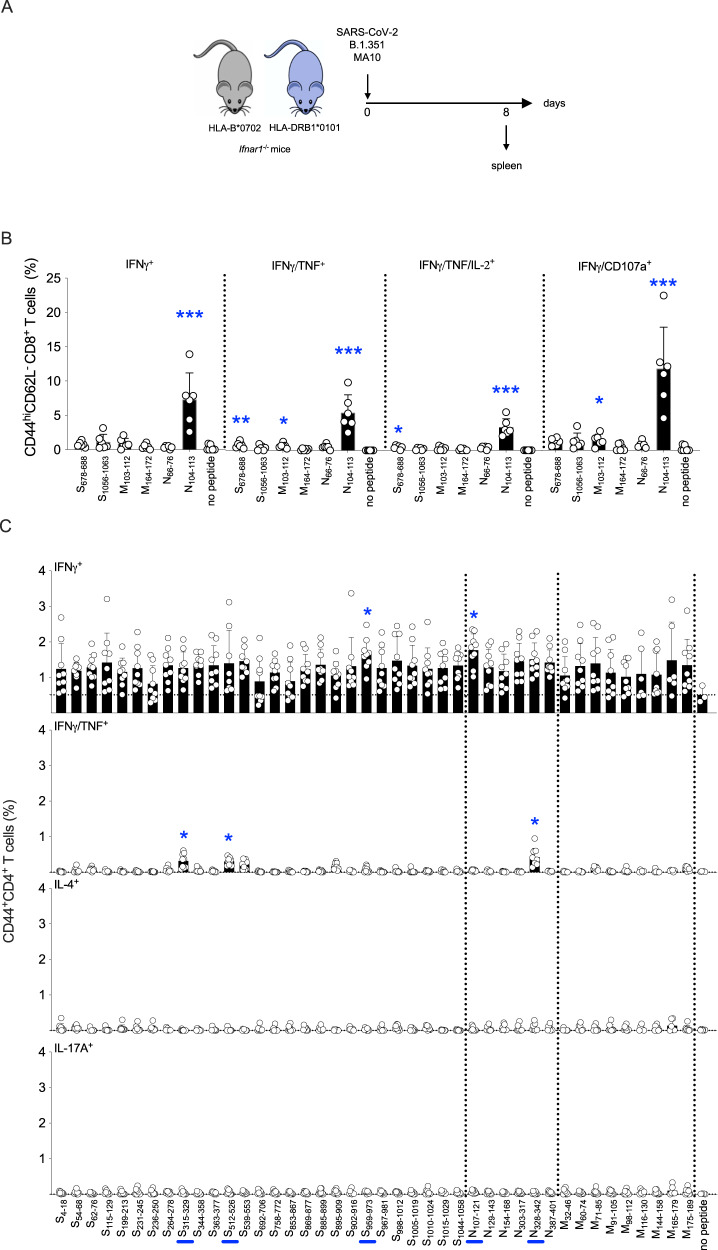
Fig. 2. Mapping of SARS-CoV-2 S, N, and M protein-derived epitopes in SARS-CoV-2-infected HLA-B*0702 and HLA-DRB1*0101 Ifnar1−/− mice.
A Experimental protocol. HLA-B*0702 and HLA-DRB1*0101 Ifnar1−/− mice were infected with SARS-CoV-2 strains B.1.351 or MA10, respectively (104 PFU, IN), and spleens collected 8 days later. B, C ICS analysis of activated CD8+ T cells from B.1.351-infected HLA-B*0702 Ifnar1−/− mice (B) and activated CD4+ T cells from MA10-infected HLA-DRB1*0101 Ifnar1−/− mice (C). Splenocytes were stimulated for 6 h with the indicated 6 (B) or 42 (C) SARS-CoV-2 peptides (vs no peptide), immunolabeled for cell surface markers, intracellular cytokines, and the degranulation marker CD107a, and analyzed by flow cytometry. Data are presented as the mean ± SEM. N values: 6 (B) and 9 (C) mice/group, pooled from 2 independent experiments. Peptide vs control were compared using the nonparametric Kruskal–Wallis test. *P < 0.05; **P < 0.01; ***P < 0.001. Circles, individual mice. Blue bars on the x-axis, peptides that significantly stimulated CD4+ T cells with at least 1 secretion phenotype.

