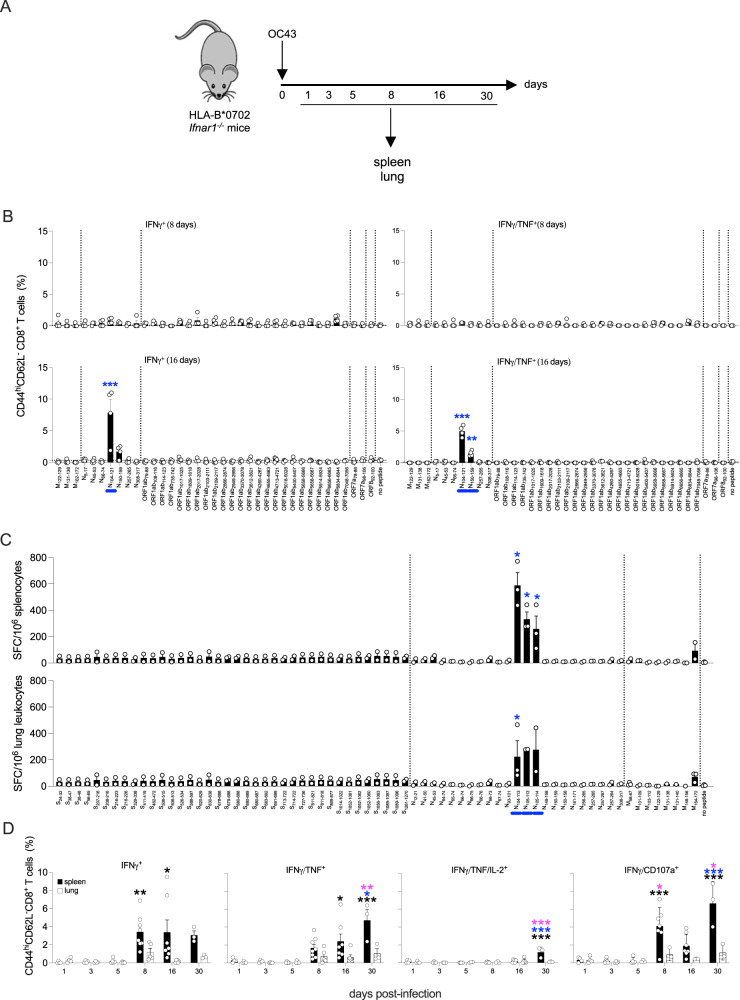
Fig. 3. Cross-reactivity of OC43-elicited CD8+ T cells for SARS-CoV-2 peptides.
A Experimental protocol. HLA-B*0702 Ifnar1−/− mice were infected with OC43 (109 genomic equivalents (GE), IN), and tissues were collected on multiple days. B ICS analysis of activated CD8+ T cells in splenocytes stimulated for 6 h with 1 of 37 published HLA-B*0702-restricted SARS-CoV-2-derived peptides (Table 2) vs no peptide, immunolabeled for cell surface markers and intracellular cytokines, and analyzed by flow cytometry. Circles, individual mice; N = 4 mice/group. C ELISpot quantification of IFNγ-producing SFCs in splenocytes and lung leukocytes isolated on day 8 post-infection and stimulated for 20 h with 69 SARS-CoV-2 peptides (Table 1) vs no peptide. N = 6 mice/group. D ICS analysis of activated CD8+ T cells in splenocytes (black bars) and lung leukocytes (white bars) isolated on multiple days. Cells were stimulated for 6 h with SARS-CoV-2 N104-113 peptide, immunolabeled for cell surface markers, intracellular cytokines, and CD107a, and analyzed by flow cytometry. Circles, individual mice; N = 4, 4, 5, 8, 7, and 3 mice/group for spleen samples and N = 4, 4, 5, 5, 6, and 3 for lung leukocytes samples from days 1, 3, 5, 8, 16, and 30, respectively. Black, blue, and pink asterisks, comparisons vs day 1, day 8, and day 16 data, respectively. B–D Data, pooled from two independent experiments, are presented as the mean ± SEM, and compared by either the nonparametric Kruskal–Wallis test (B, C) or two-way ANOVA with Sidak’s multiple comparison test (D). *P < 0.05; **P < 0.01; ***P < 0.001. Blue bars on the x-axis in B and C, peptides that significantly stimulated 1 or more cell groups.

