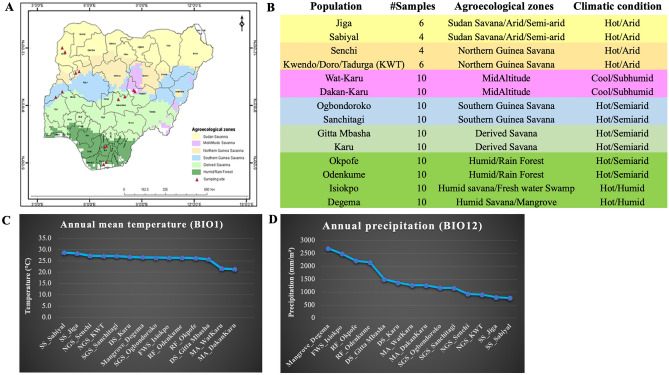
Figure 1.
(A) Nigerian agro-ecological map showing sampling locations (figure modified from https://redd.unfccc.int/files/nigeria_national_frel_modified_revised__for_posting.pdf), (B) details of the studied chicken populations, (C) ordering of populations based on mean annual temperature, (D) ordering of populations based on mean annual precipitation. The means in (C) and (D) are based on 40 years of data (1960–2000) from the Worldclim database11.

