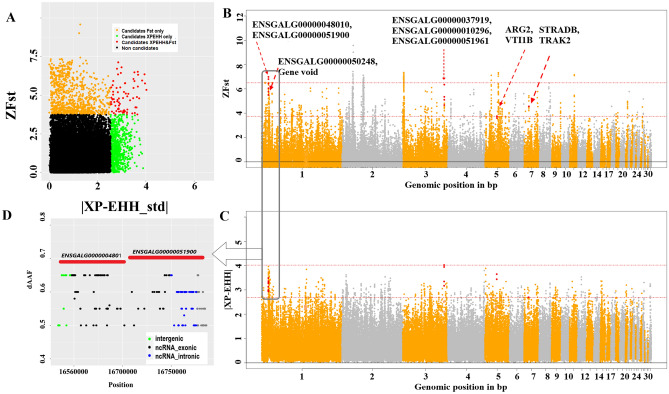
Figure 5.
Selection signature analysis results for birds from regions of high and low precipitation. (A) Scatter plot of standardized values of XP-EHH versus Fst. (B,C) Manhattan plots for the Fst and XP-EHH analyses; common windows are marked with an asterisk along with gene names from common windows; the red dashed line represents ZFst and |XP-EHH| threshold. (D) Closer look at the common Fst/XP-EHH region—chr1: 16630000–16790000 with SNPs showing allele frequency difference (dAAF) > 0.5 between the hot arid and hot humid groups.

