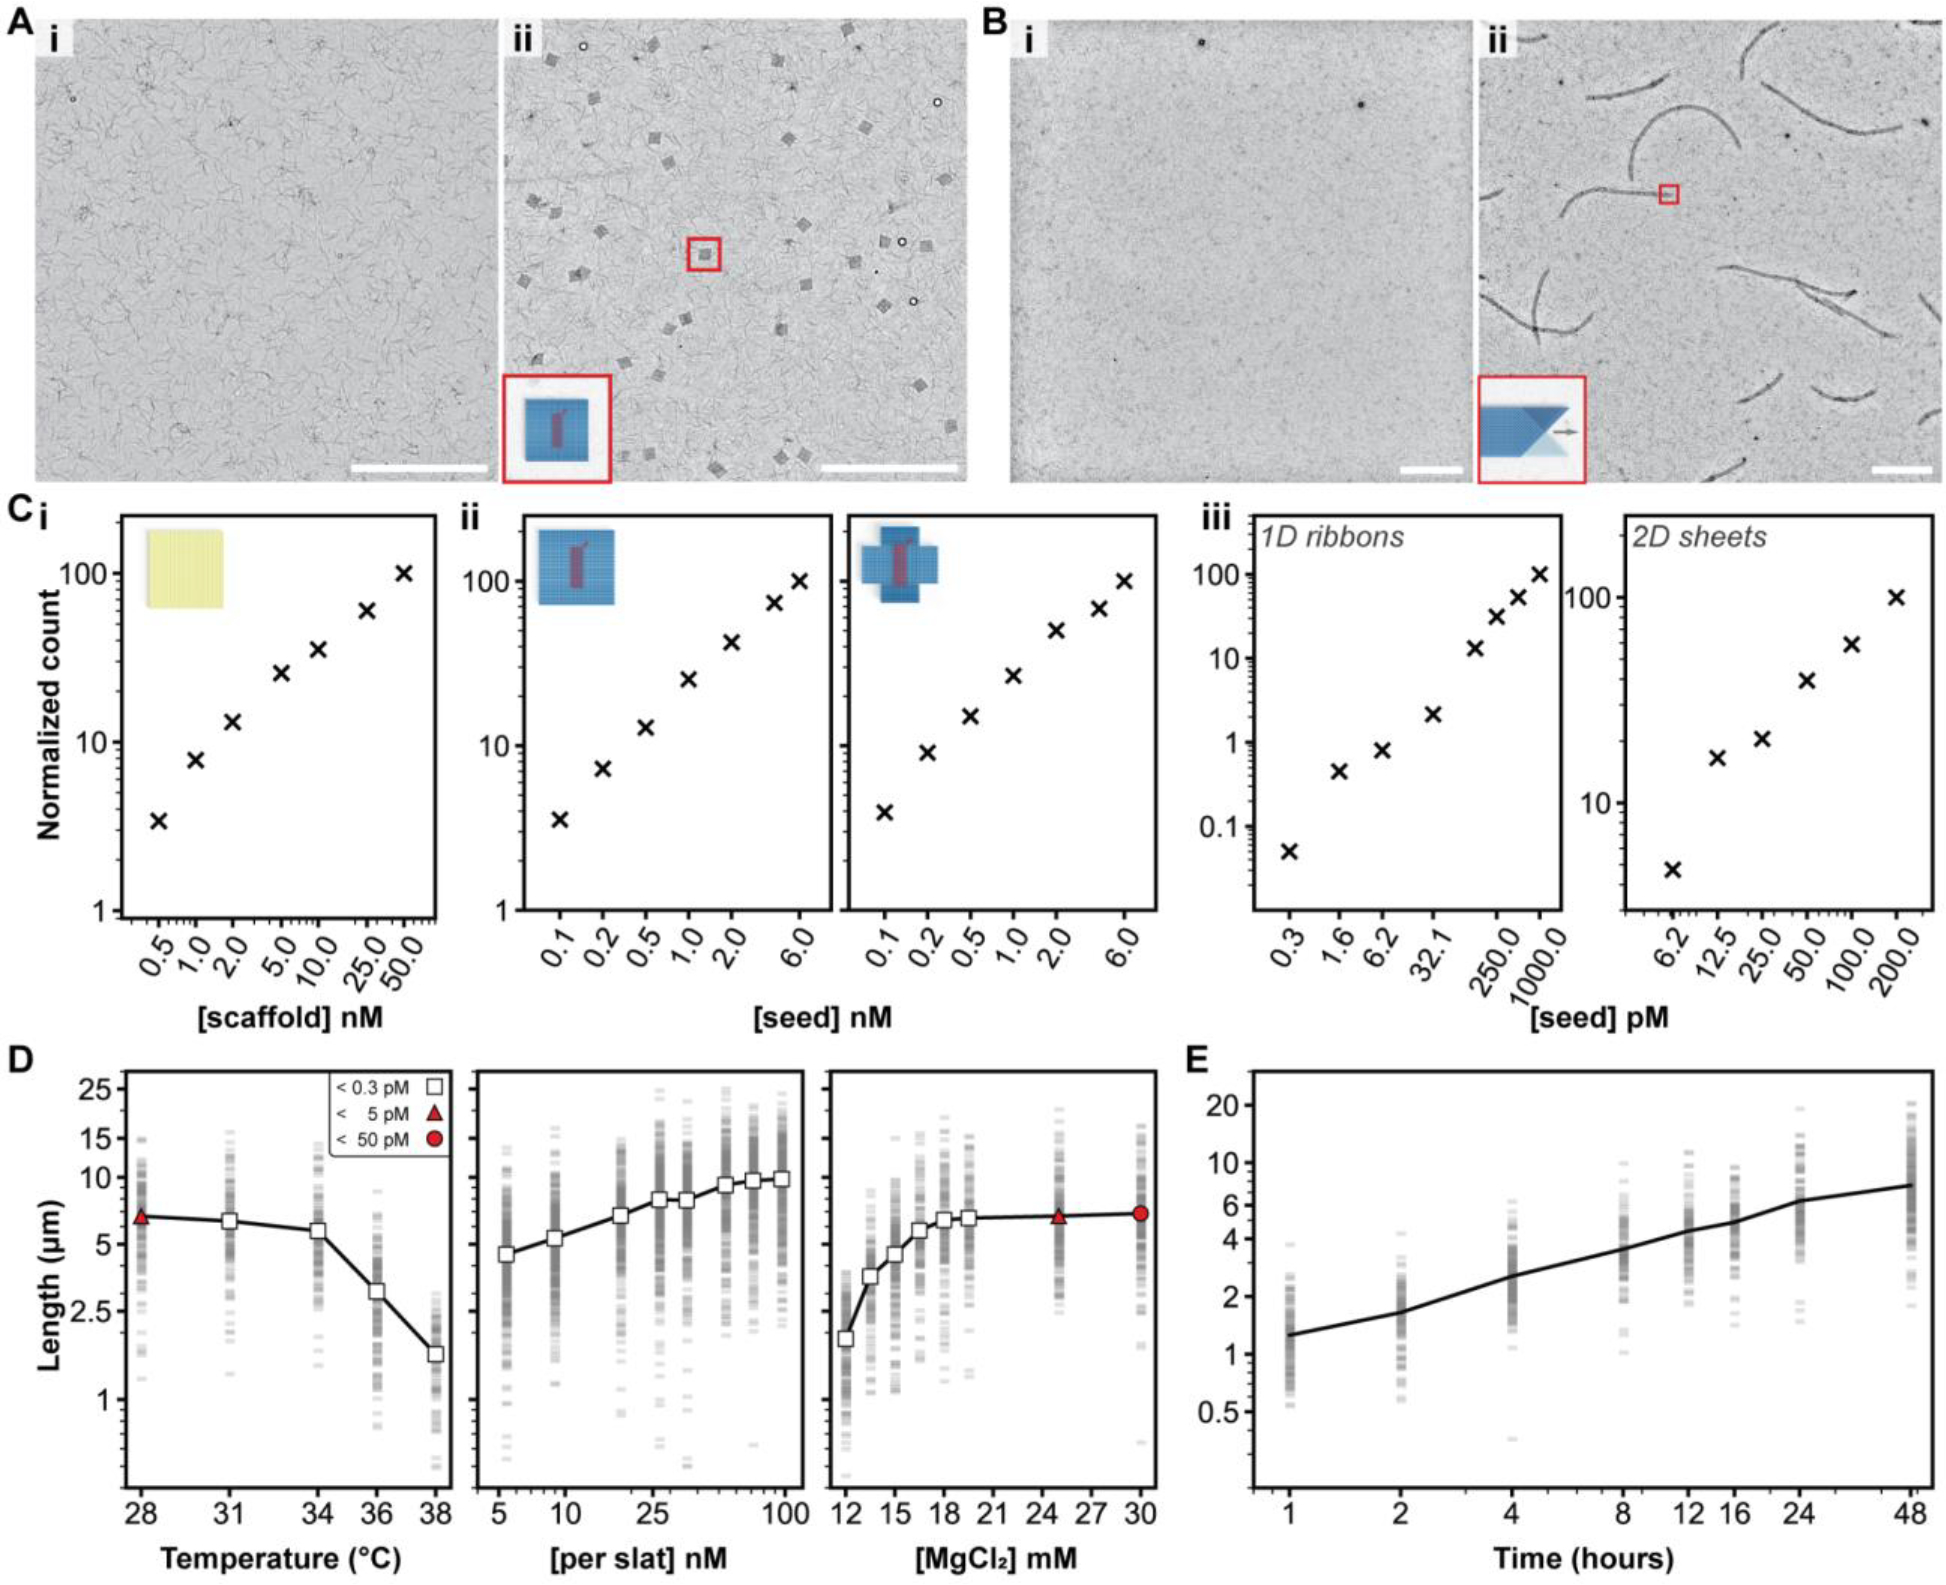
Figure 5.

Characterization of growth versus reaction parameters. A and B, seed-controlled assembly of the finite 64-slat square and the periodic 1D ribbon in low magnification TEM images, with no seed versus seed in i and ii, respectively. Ci, the number of DNA-origami squares formed versus the amount of scaffold added, Cii, the number of finite squares (left) or plus symbols (right) versus amount of seed added, and Ciii, the number of periodic megastructures versus the amount of seed added. The relative number of particles per condition is shown with the ‘×’ marker. D, how the length of v16 1D ribbons with 7-nt binding sites varies as a function of temperature, concentration of slats, and concentration of MgCl2. Each faint gray bar is a single ribbon measurement. The white markers indicate no spontaneous assembly above the detection limit, versus red markers where spontaneous assembly was observed to the degree shown in the legend in the leftmost plot. E, the length of the v16 1D ribbons versus time, grown at 20 nM of each slat. Axes in all plots are on a log10 scale, with the exception of the temperature and MgCl2 scale in D. All scale bars are 5 μm, particle counts in C were determined by counting structures in ten low-magnification TEM images, and ~150 ribbons were measured per condition in D and E.
