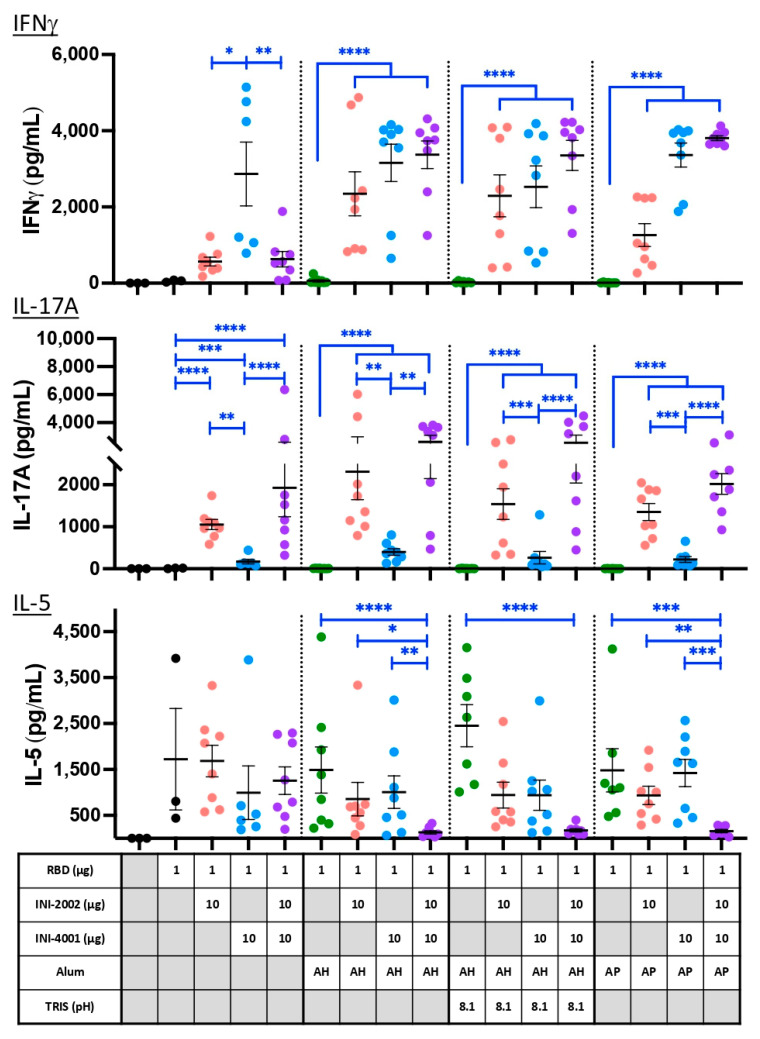
Figure 9.
Cytokine release from RBD-specific T cells upon restimulation. Cytokine concentrations in supernatants recovered from a 72 h culture of ex vivo dLN cell suspensions stimulated with 10 µg/mL RBD protein. Five days after a third vaccination, cells were recovered and cultured to assess the phenotype of RBD-specific T cells. Black lines indicate the mean and standard error of the mean for each group, while individual mice are represented by symbols. Symbols for formulations containing only alum are green, those with INI-2002 are red, INI-4001 blue, and both together are purple. Black asterisks designate significant differences compared with the RBD antigen-only group (black). Blue lines and asterisks specify significant differences among groups receiving the same type of formulation (aqueous or alum type) * = p < 0.05, ** = p < 0.01, *** = p < 0.001, **** = p < 0.0001.

