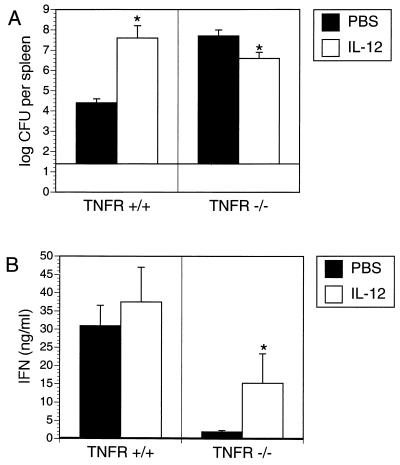
FIG. 6.
Bacterial numbers in the spleen (A), and IFN-γ production by spleen cells (B) from C57BL/6 TNFR p55+/+ and C57BL/6 TNFR p55−/− mice 5 days after infection with 2 × 10⁴ or 2 × 10² Y. enterocolitica, respectively, and i.p. administration of PBS or 1 μg of IL-12 on days −1, 0, +1, +2, and +3 p.i. The asterisks indicate statistically significant differences (P < 0.01) compared with the values obtained with the control group.

