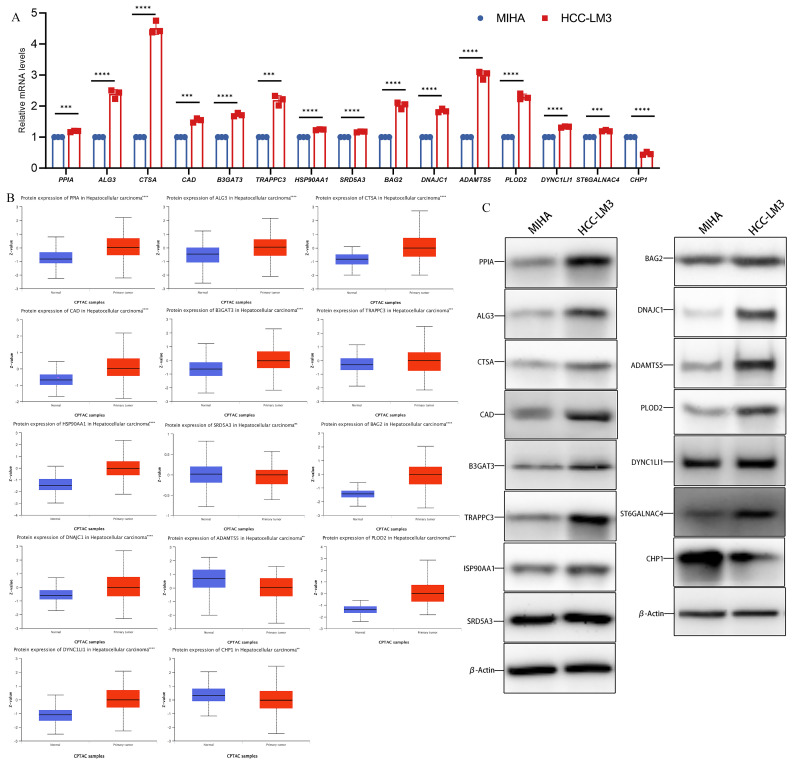
Figure 2.
The relative expression level of glycosylation-related prognostic genes. (A) The relative mRNA level of PPIA, ALG3, CTSA, CAD, B3GAT3, TRAPPC3, HSP90AA1, SRD5A3, BAG2, DNAJC1, ADAMTS5, PLOD2, DYNC1LI1, ST6GALNAC4, and CHP1. (B) Expression of 15 hub genes in HCC primary tumor samples and adjacent normal tissues at the protein level from the CPTAC database (n = 165). (C) Expression of 15 hub genes in MIHA cell and HCC-LM3 cell at the protein level. (Data are presented as the mean ± SD, ** p < 0.01, *** p < 0.001, **** p < 0.0001, and ns, no significance.).

