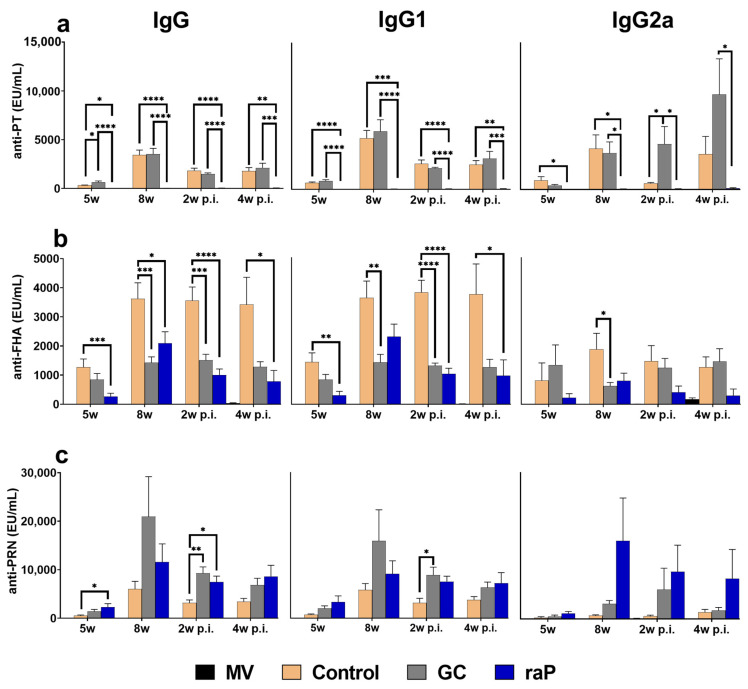
Figure 3.
Humoral responses. IgG, IgG1, and IgG2a antibody titers to vaccine antigens (PT NIBSC 15/126, FHA NIBSC JNIH-4, PRN NIBSC 18/154) were determined using ELISA assay. Serum was collected and analyzed at 3 weeks after inoculation with the second primary vaccine (5 weeks), 3 weeks after inoculation with the booster (8 weeks), and at 2 and 4 weeks post-infection with pertussis (ATCC 9797). Data are presented as mean ± standard errors of the mean (SEM) (EU/mL). Results were obtained from eight animals per group at 5 weeks and 8 weeks, and five animals per group post-infection. (a) PT. (b) FHA. (c) PRN. Between-group differences were investigated using one-way ANOVA and Bonferroni’s post hoc test, and p values are visualized as follows: * p < 0.05, ** p < 0.01, *** p < 0.001, **** p < 0.0001. The differences with the mocked-vaccine group are not shown. EU, ELISA unit; MV, mock vaccinated.

