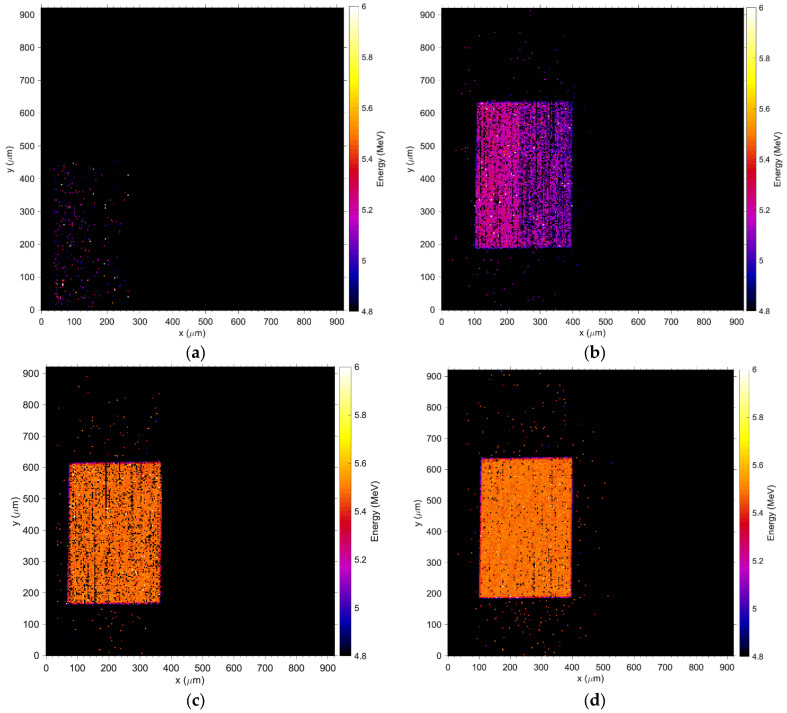
Figure 9.
Wafer10 Median Energy Maps; (a) −28 V, (b) −29 V, (c) −31 V and (d) −32 V. The coordinates in x and y are obtained using a calibration factor that converts the electric potentials applied to the steering magnets of the accelerator to a physical distance of the spot at the plane where the device under test is positioned, please refer to [39] for details on the calibration procedure adopted at ANSTO. The coordinate frames of the pictures are consistent between the figures but they can be obtained using a different offset, which results in a shift of the map relative to the axis.

