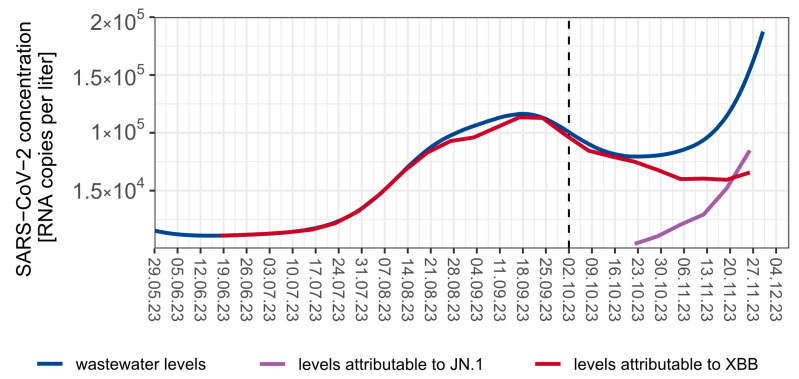
Figure 2.
Combined SARS-CoV-2 viral concentrations in Berlin from 29 May to 26 November 2023 (last sampling date), using data from three wastewater treatment plants (Ruhleben, Schönerlinde and Wassmannsdorf), covering 84% of the Berlin population. The blue line represents the total amount of target RNA copies per liter over time, the red curve indicates XBB attributed RNA copies per liter, and the violet line shows BA.2.86.x attributed RNA copies per liter.

