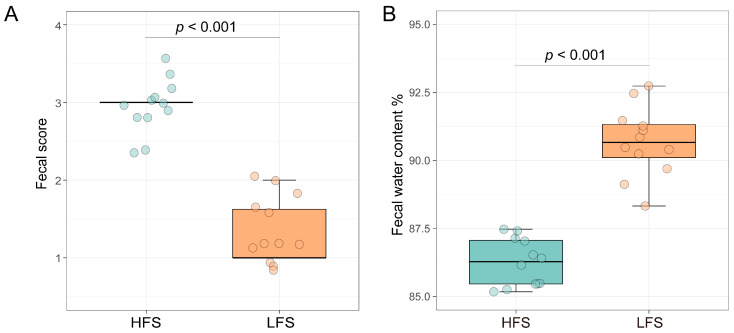
Figure 1.
Fecal score (A) and water content (B) of dairy cows with diarrheic and non-diarrheic phenotypes. LFS: low fecal score (n = 12); HFS: high fecal score (n = 12). Boxes represent the interquartile range (IQR) between the first and third quartiles, and the horizontal line inside the box represents the median. Whiskers represent the lowest and highest values within 1.5 times the IQR from the first and third quartiles, respectively. The green color represents the HFS group and the orange colour represents the LFS group, and the circles indicate each cow’ fecal score.

