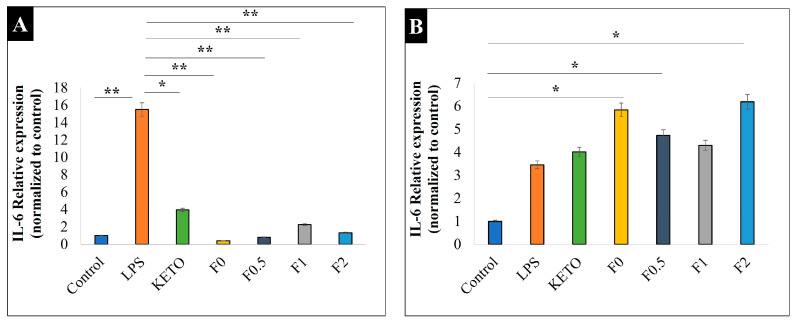
Figure 8.
Relative expression of IL-6 on two cell lines: (A) U937 and (B) A549. Control is the untreated cell line, LPS is the treated cell line, KETO, F0, F0.5, F1, and F2 are treated with LPS. Results are expressed as mean ± SD (n = 3 independent measurements). Level of significance: (* p < 0.05), (** p < 0.01).

