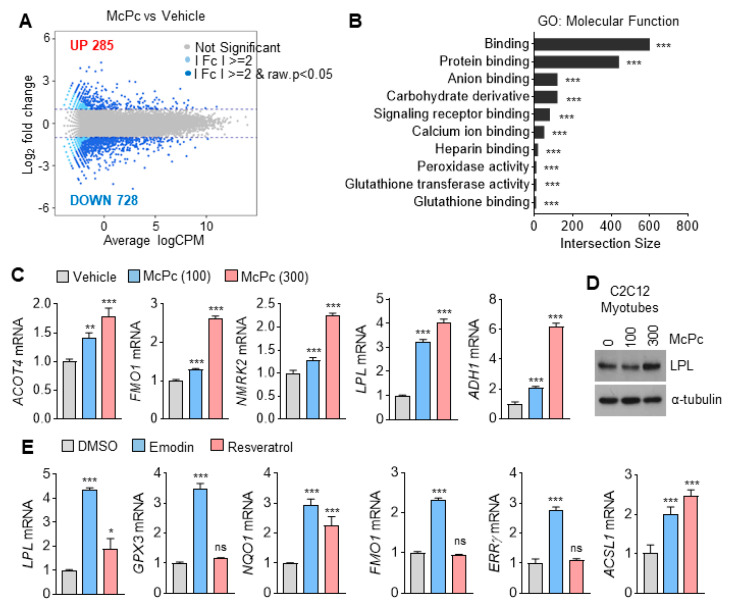
Figure 2.
Transcriptome analysis in McPc-treated C2C12 myotubes. (A) MA plot (log2 fold change vs. average logCPM) of vehicle and McPc. (B) Gene ontology (GO) classification of differentially expressed genes. The graph shows approximately 10 GO terms with most genes annotated. The top 10 GO terms were assigned to the differentially expressed genes in C2C12 myotubes treated with or without McPc. (C) Gene expression of C2C12 myotubes incubated with McPc (μg/mL) for 24 h. (D) The protein level of LPL in C2C12 myotubes treated with various concentrations of McPc for 24 h. (E) Gene expression of C2C12 myotubes incubated with 20 μM emodin or 50 μM resveratrol for 24 h. The values represent the mean ± SD (n = 3); * p < 0.05, ** p < 0.01 and *** p < 0.001. ns = not significant. One-way analysis of variance (ANOVA) Tukey’s post hoc test was performed for statistical analysis.

