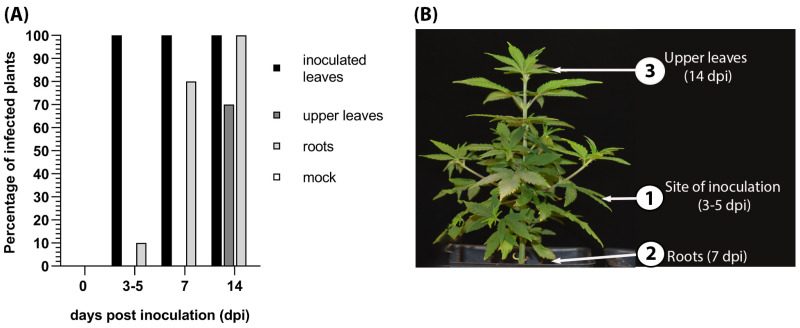
Figure 5.
Spatiotemporal distribution of hop latent viroid (HLVd) in infected hemp. (A) Graph representing the percent of inoculated leaves, upper leaves, and roots that were positive for HLVd using a RT-PCR diagnostic test. There were zero plants infected with HLVd among the “mock” samples. (B) Schematic diagram of HLVd progression upwards in hemp plants showing the sampling locations (1), (2), and (3).

