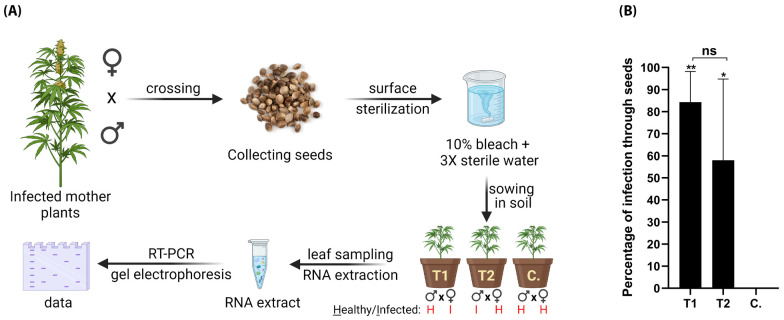
Figure 8.
Vertical transmission of HLVd via hemp seeds. (A) Schematic diagram illustrating procedures for testing seed transmission. HLVd-infected hemp females crossed with pollen from healthy male hemp (T1), and healthy females crossed with HLVd-infected pollen (T2). Newly emerging plants were RT-PCR tested for HLVd. (B) Percentage of HLVd-positive plants emerged from 300 seeds in each treatment and a total of 100 seeds for the control (C.). Results were statistically analyzed using one-way ANOVA followed by Tukey’s post hoc HSD test. Values are the mean of three independent replicates (100 seeds/replicate) and vertical bars are the standard error means. Asterisks (** and *) denote significance between treatments and untreated control at p = 0.05. ns: not significant.

