
FIGURE 4.
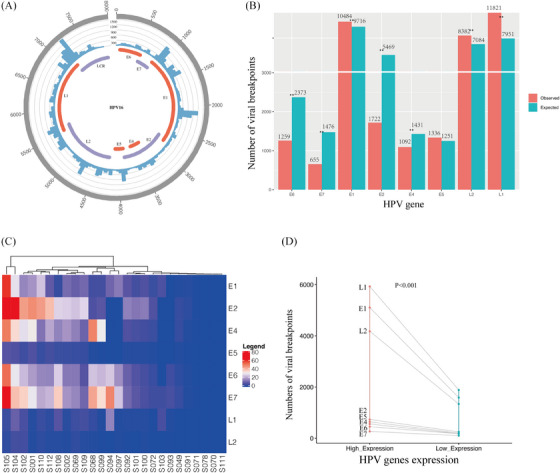
Distribution of HPV breakpoints on the HPV genome. (A) Distribution of viral breakpoints within the HPV16 genome across 93 samples. Histograms depicts the frequency of breakpoints in the samples. Histogram axis units represent breakpoints numbers. (B) Comparison of observed (red) and expected (green) numbers of breakpoints in the HPV genome. p Values were determined through Chi‐square test. ‘*’ indicates p < .05. ‘**’ indicates p < .01. (C) Heatmap demonstrating the expression levels of HPV genes in 26 samples subjected to RNA sequencing. (D) Comparison of breakpoint counts for each HPV gene between samples with high and low viral gene expression.