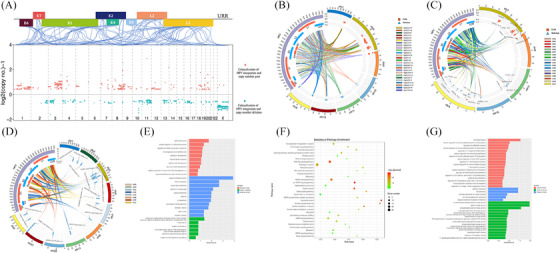
FIGURE 6.

Characterisation of HPV integration sites co‐occurred with host genomic CNVs. (A) Distribution of integrated genes co‐located with nearby CNVs in human genomes. The blue linking lines indicate the location of integration breakpoints on the human chromosome and the HPV genome. The red dot represents copy number gained genes with viral integration nearby, while blue dots indicated copy number deleted genes with viral integration nearby. (B) Circos plot showing the connection between the HPV genome and human chromosome cytobands exhibiting a high frequency of viral integration and CNVs. In the inner circle, histogram units denotes log2(copy number)−1. The red squares indicate positions of copy number gained genes with viral integration, and the blue triangles indicate positions of deleted genes with viral integration. (C) Circos plot showing connections between the HPV genome and specific human genes with a high frequency of viral integration and CNVs across all samples. In the inner circle, histogram units represent log2(copy number)−1. The red squares indicate positions of copy number gained genes with viral integration. The blue triangles indicate positions of deleted genes with viral integration. “N” indicates the number of samples with co‐occurrence of CNVs and HPV integration in this gene. (D) Circos plot illustrating the connections between the HPV genome and specific human genes exhibiting a high frequency of viral integration and CNVs in one specific sample. In the inner circle, histogram units represent the number of integration sites in this gene of the sample. (E) Gene Ontology (GO) analysis for genes exhibiting co‐occurrence of viral integration and copy number deletion. (F) Kyoto Encyclopedia of Genes and Genomes (KEGG) pathway analysis for genes exhibiting co‐occurrence of viral integration and copy number gain. (G) GO analysis for the genes exhibiting co‐occurrence of viral integration and copy number gain.
