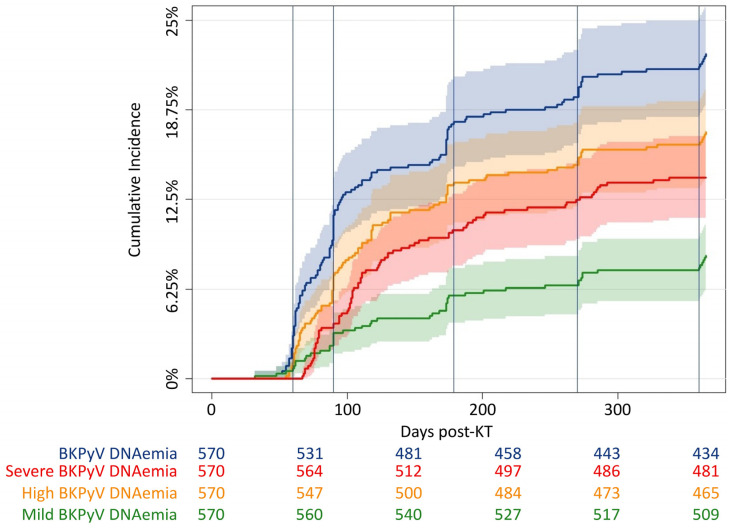
Figure 1.
Cumulative incidence curves of BKPyV DNAemia. Cumulative incidence of any BKPyV DNAemia (blue), severe BKPyV DNAemia (red), high BKPyV DNAemia (yellow, a single BKPyV DNA estimate ≥ 10,000 copies/mL), and mild BKPyV DNAemia (green, a single BKPyV DNA estimate ≥ 10,000 copies/mL without progression to severe BKPyV DNAemia) within the first year post-KT. Vertical lines at scheduled screening days: at days 30, 60, 180, 270, and 360, respectively.

