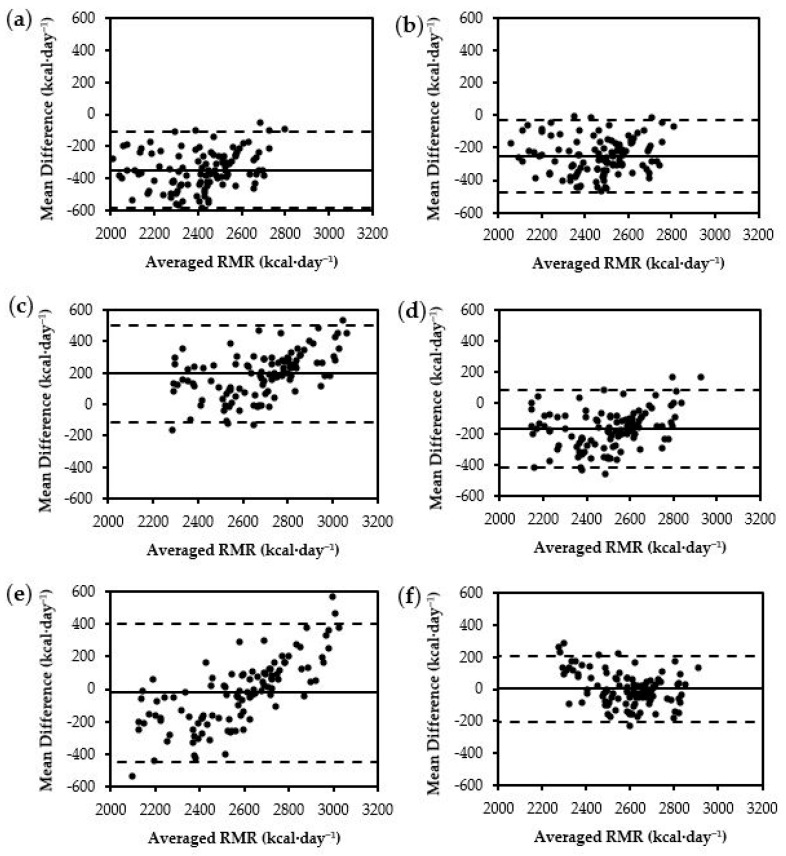
Figure 2.
Bland–Altman plots for BM equations: (a) Harris–Benedict, (b) ten Haaf BM, (c) Jagim, (d) Mackenzie-Shalders BM, (e) Tinsley BM, (f) Posthumus BM. The middle, solid, horizontal line represents the constant error. The lower and upper dashed horizontal lines represent the 95% limits of agreement.

