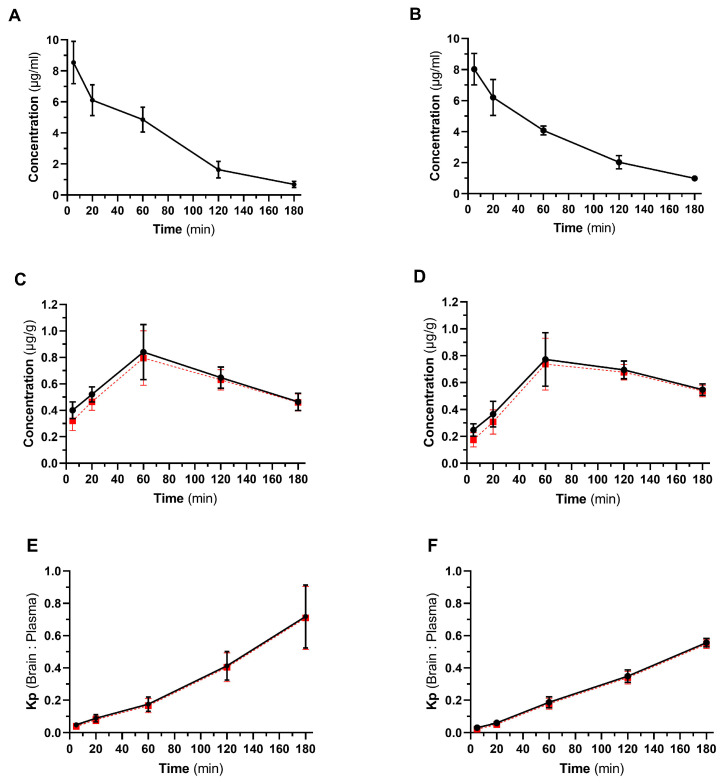
Figure 3.
Pharmacokinetic profile of milnacipran after IP and IV administration in mice. Panels (A,B), time course of milnacipran plasma concentration after IP (A) and IV (B) administration. Panels (C,D), time course of milnacipran brain concentration after IP (C) and IV (D) administration. Panels (E,F), calculated Kp values (brain-to-plasma ratio) for IP (E) and IV (F) administered milnacipran (30 mg/kg, n = 4 for each time point, mean ± SD are presented). Red dash lines represent the calculated brain concentrations (panels (C,D)) and Kp values (panels (E,F)) of milnacipran after correction for the drug present in the brain vasculature.

