Figure 2.
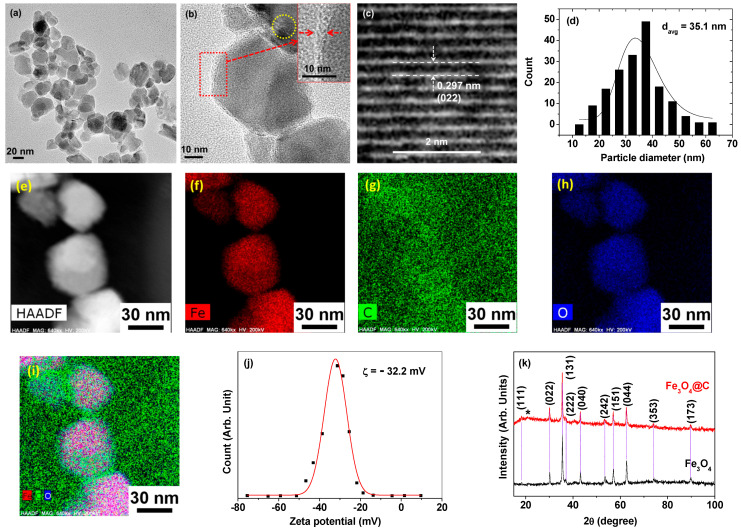
(a) HRTEM image. (b) Magnified HRTEM image: the dotted square is further magnified on the top right to show carbon-coating shell thickness, labeled with two arrows. Dotted circle is further magnified in (c) to show (022) plane lattice fringes. (d) Particle diameter distribution of the Fe3O4@C NPs obtained from the HRTEM images and the log-normal function fitting curve. (e) HAADF-STEM image of the Fe3O4@C NPs and elemental mapping of (f) Fe (red), (g) C (green), (h) O (blue), and (i) merged elements. (j) Zeta potential curve in the aqueous solution. (k) XRD patterns of the Fe3O4 and Fe3O4@C NPs: all XRD peaks (indicated with vertical dotted lines) were assigned based on (hkl) Miller indices matching FCC Fe3O4. The broad peak at 2θ = ~21° (labeled as *) for the Fe3O4@C NPs is due to amorphous carbon.

