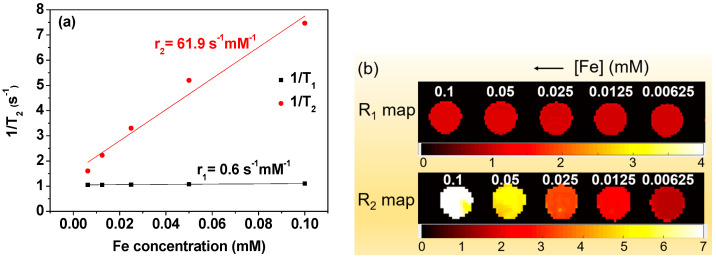
Figure 6.
(a) Plots of 1/T1 and 1/T2 inverse relaxation times versus Fe concentration. The slopes correspond to the r1 and r2 values, respectively. (b) R1 and R2 map images as a function of Fe concentration, showing clear dose-dependent contrast enhancement in the R2 map images but negligible dose-dependent contrast enhancement in the R1 map images; the scale unit is s−1.

