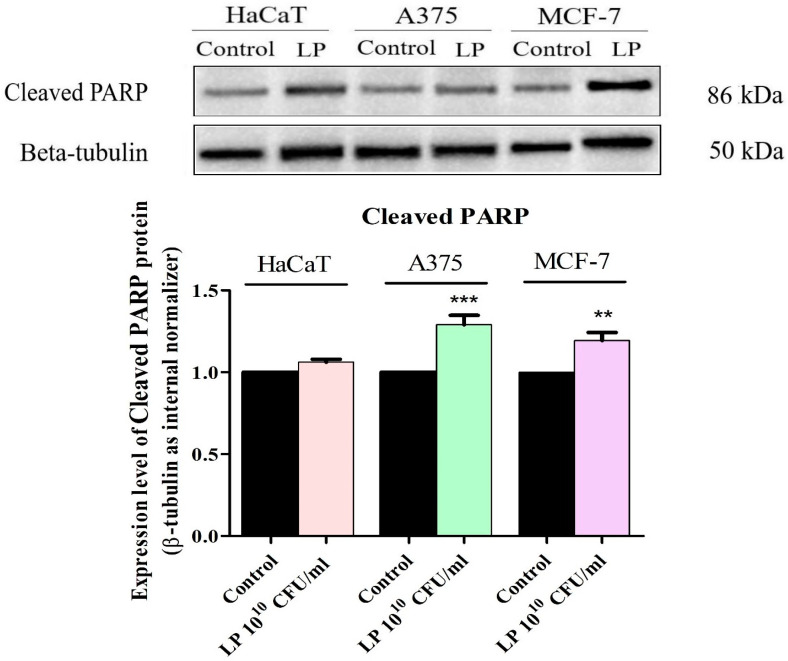
Figure 6.
Determination of cleaved PARP protein expression in HaCaT, A375, and MCF-7 cells. The results were normalized against the beta-tubulin loading control and the control group. The statistical differences vs. control were determined using one-way ANOVA analysis followed by Tukey’s multiple comparisons post-test ( ** p < 0.01, and *** p < 0.001).

