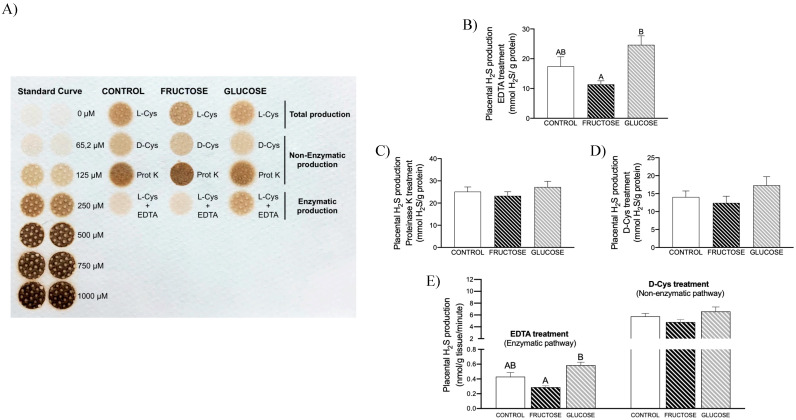
Figure 2.
Carbohydrate (fructose or glucose) consumption during pregnancy affects H2S production in placenta. (A) Membrane showing lead acetate precipitates formed in the assay: Total H2S generation in the presence of L-Cys (after 3 h of incubation); enzymatic production of H2S after EDTA treatment (and 24 h of incubation); and non-enzymatic synthesis of H2S after proteinase K treatment or in the presence of D-Cys (after 3 h of incubation). Darker precipitates indicate higher H2S production in the tissue. Enzymatic (B) and non-enzymatic (proteinase K, (C)) or (D-Cys, (D)) placental H2S levels of control (empty bar), fructose-fed (grey bar), or glucose-fed (black bar) pregnant rats. (E) To compare the different H2S production rates between enzymatic and non-enzymatic pathways in placenta, different scales were used for the y axis before and after the break. Data are expressed as means ± S.E., n = 7 (control); 7 (fructose); and 6 (glucose) rats. Net H2S produced was expressed as nanomoles per gram of protein; H2S production rates were expressed as nanomoles per minute per gram of tissue. Values not sharing a common letter are significantly different (p < 0.05).

