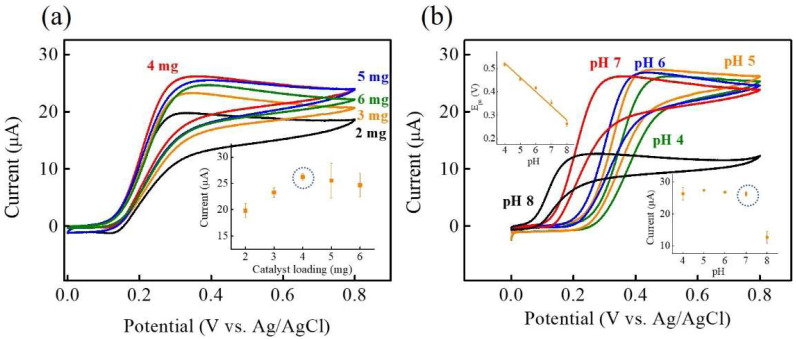
Figure 6.
CV curves of Ni-Co-P NSs/Nafion/GCE at different (a) mass loading of Ni-Co-P NSs (2, 3, 4, 5, and 6 mg) and (b) pH (4, 5, 6, 7, and 8) in 0.1 M PBS in the presence of 0.1 mM DA at a scan rate of 50 mV s−1. Inset of (a) plot of the anodic peak current (Ipa) versus the different mass loading of Ni-Co-P NSs. Insets of (b) plot of the anodic peak potential (Epa) versus pH (upper-left inset) and plot of the anodic peak current (Ipa) versus pH (bottom-right inset). (The error bars represent the standard deviation of 3 repeat measurements).

