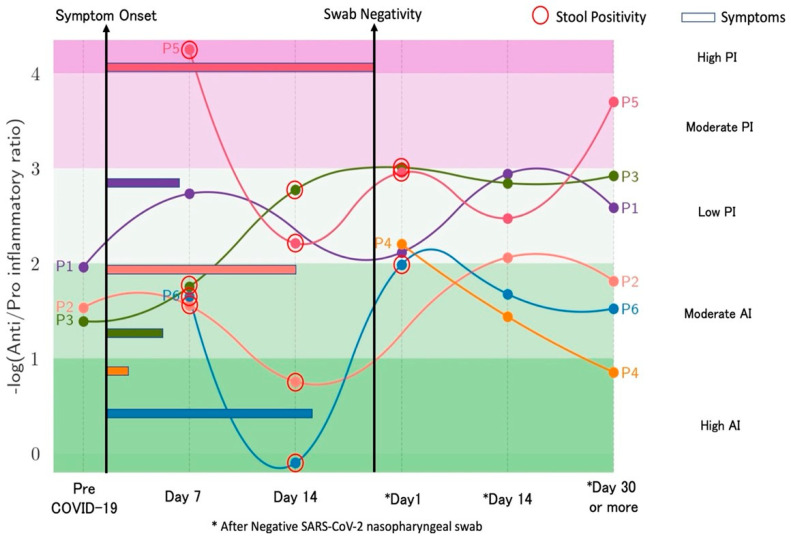
Figure 1.
Clinical status and trends of inflammation ratio over time. Trajectories of study participants are shown prior (P1, 2, 3) and before/after (all patients) SARS-CoV-2 are shown. Swab negativity indicates no isolation of SARS-CoV-2 by nasopharyngeal swab. Red circles identify stool positivity and colored bars indicate the duration of COVID-19 related symptoms. The spectrum of colors (values between −0.2 and 4.4 according to the anti/proinflammatory ratio) identifies 5 levels of inflammation, namely highly anti-inflammatory (AI), moderately AI, low proinflammatory (PI), moderately PI, highly PI.

