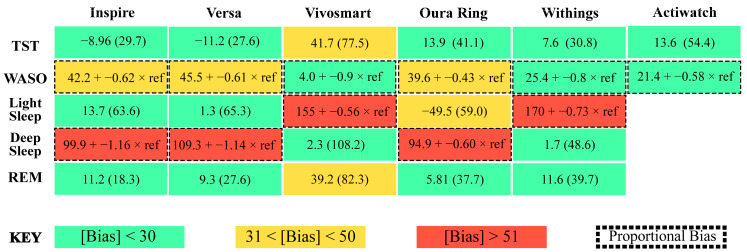
Figure 7.
Summary figure depicting absolute bias in sleep measurements for each device. TST = total sleep time, WASO = wake after sleep onset, green boxes = absolute bias < 30, yellow boxes = absolute bias between 31 and 50, red boxes = absolute bias > 51, boxes with dotted outlined = proportional bias.

